## Line Graph: Time vs. Weight
### Overview
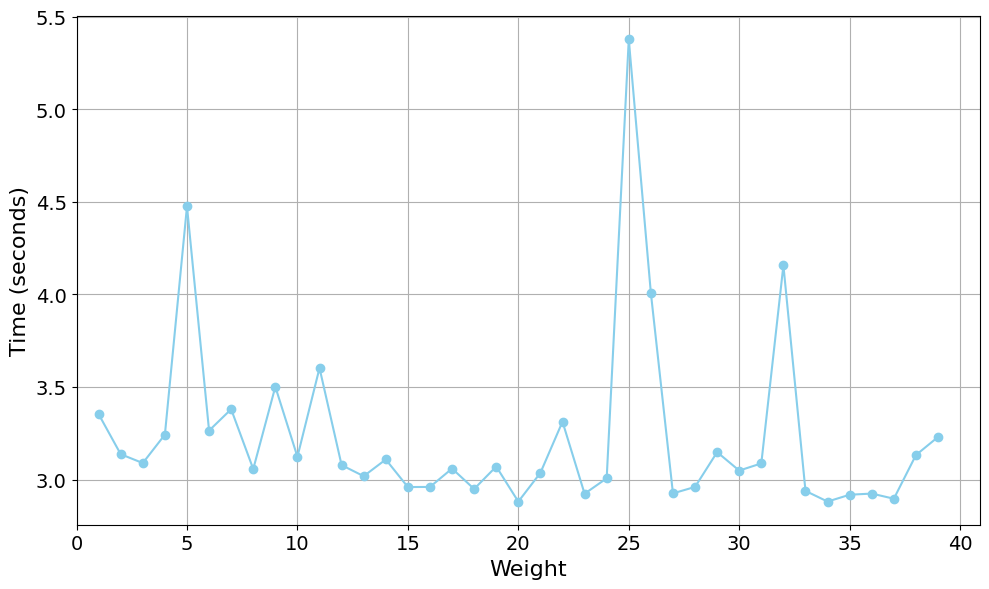
The image depicts a line graph illustrating the relationship between "Weight" (x-axis) and "Time (seconds)" (y-axis). The graph shows a fluctuating blue line with notable peaks and troughs, suggesting variability in time measurements across different weight values. The y-axis ranges from 0 to 5.5 seconds, while the x-axis spans from 0 to 40 units of weight.
### Components/Axes
- **X-axis (Weight)**: Labeled "Weight," with numerical markers at intervals of 5 (0, 5, 10, ..., 40).
- **Y-axis (Time)**: Labeled "Time (seconds)," with markers at 0.5-second intervals (0, 0.5, ..., 5.5).
- **Legend**: Located in the top-right corner, the blue line is explicitly labeled as "Time (seconds)."
- **Line**: A single blue line connects data points across the graph, with no additional series or legends.
### Detailed Analysis
- **Key Data Points**:
- **Peaks**:
- At **Weight = 5**, Time = **4.5 seconds** (highest peak).
- At **Weight = 25**, Time = **5.4 seconds** (absolute maximum).
- At **Weight = 32**, Time = **4.2 seconds** (secondary peak).
- **Troughs**:
- At **Weight = 15**, Time ≈ **3.0 seconds** (lowest point).
- At **Weight = 20**, Time ≈ **3.0 seconds** (another trough).
- At **Weight = 35**, Time ≈ **3.0 seconds** (final trough).
- **General Range**: Time fluctuates between **3.0 seconds** (minimum) and **5.4 seconds** (maximum).
- **Trends**:
- The line exhibits **no consistent upward or downward trend**, with irregular fluctuations.
- Sharp increases occur between **Weight = 5–10** and **Weight = 20–25**, followed by steep declines.
- The highest time (5.4 seconds) occurs at **Weight = 25**, while the lowest (3.0 seconds) is observed at multiple points (15, 20, 35).
### Key Observations
1. **Outliers**: The peak at **Weight = 25** (5.4 seconds) is significantly higher than all other points, suggesting an anomaly or critical threshold.
2. **Pattern**: Time increases sharply at specific weights (e.g., 5, 25) but drops abruptly afterward, indicating possible non-linear relationships.
3. **Consistency**: The lowest time (3.0 seconds) repeats at multiple weights, hinting at a potential optimal range.
### Interpretation
The graph suggests that **time increases unpredictably with weight**, with no clear linear correlation. The sharp peaks at **Weight = 5, 25, and 32** may indicate specific conditions or thresholds where time measurements spike, possibly due to external factors (e.g., equipment limitations, measurement errors). The repeated troughs at **3.0 seconds** could represent a baseline or optimal performance range. The lack of a consistent trend implies that the relationship between weight and time is either non-linear, influenced by confounding variables, or subject to measurement noise. Further investigation into the context of the data (e.g., experimental setup, units of weight) would be necessary to draw definitive conclusions.