### Image Analysis: Technical Performance Metrics
#### (a) Generation Stage Time Distribution
- **Pie Chart Labels**:
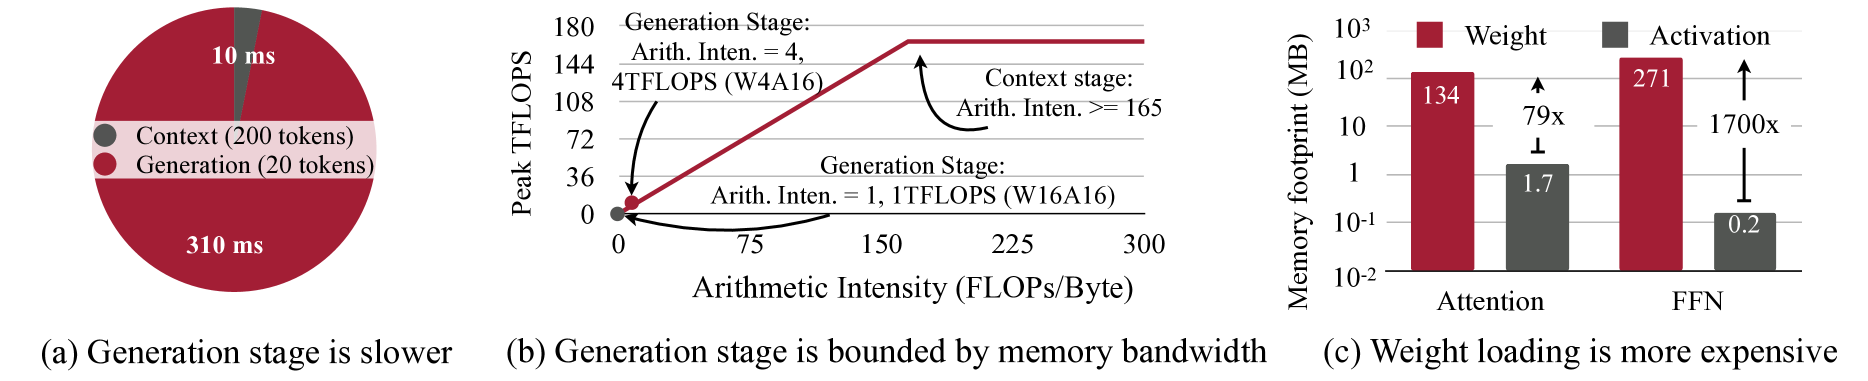
- **Context (200 tokens)**: 10 ms (dark gray segment)
- **Generation (20 tokens)**: 310 ms (dark red segment)
- **Total Time**: 310 ms (sum of context and generation stages)
---
#### (b) Generation Stage Bounded by Memory Bandwidth
- **Line Graph**:
- **X-axis**: Arithmetic Intensity (FLOPs/Byte) ranging from 0 to 300.
- **Y-axis**: Peak TFLOPS (0 to 180).
- **Lines**:
- **Generation Stage**:
- **Arithmetic Intensity = 1**: 1 TFLOPS (W16A16).
- **Arithmetic Intensity = 4**: 4 TFLOPS (W4A16).
- **Arithmetic Intensity = 165**: 4 TFLOPS (W4A16).
- **Context Stage**:
- **Arithmetic Intensity = 165**: 4 TFLOPS (W4A16).
- **Annotations**:
- Generation stage performance plateaus at 4 TFLOPS beyond 165 Arithmetic Intensity.
- Context stage operates at 165 Arithmetic Intensity with 4 TFLOPS.
---
#### (c) Weight Loading vs. Activation Memory Footprint
- **Bar Chart**:
- **X-axis Categories**: Attention, FFN.
- **Y-axis**: Memory Footprint (MB, log scale: 10⁻² to 10³).
- **Bars**:
- **Weight (Attention)**: 134 MB (dark red).
- **Activation (Attention)**: 1.7 MB (dark gray).
- **Weight (FFN)**: 271 MB (dark red).
- **Activation (FFN)**: 0.2 MB (dark gray).
- **Annotations**:
- Weight loading is **79x more expensive** than activation for Attention.
- Weight loading is **1700x more expensive** than activation for FFN.
- **Legend**:
- **Weight**: Dark red.
- **Activation**: Dark gray.
---
### Key Trends and Data Points
1. **Time Allocation**:
- Context stage (200 tokens) consumes 10 ms.
- Generation stage (20 tokens) dominates with 310 ms (97% of total time).
2. **Arithmetic Intensity vs. TFLOPS**:
- Generation stage scales linearly with arithmetic intensity up to 165 FLOPs/Byte, then plateaus.
- Context stage remains constant at 165 FLOPs/Byte with 4 TFLOPS.
3. **Memory Footprint**:
- Weight loading dominates memory usage:
- Attention: 134 MB (weight) vs. 1.7 MB (activation).
- FFN: 271 MB (weight) vs. 0.2 MB (activation).
- Weight loading is orders of magnitude more memory-intensive than activation.
---
### Cross-Referenced Legend Consistency
- **Pie Chart**: Dark gray = Context; Dark red = Generation.
- **Line Graph**: Red line = Generation stage; Gray line = Context stage.
- **Bar Chart**: Dark red = Weight; Dark gray = Activation.