# Technical Document Extraction: Heatmap Analysis of K₁ and E_F Parameters
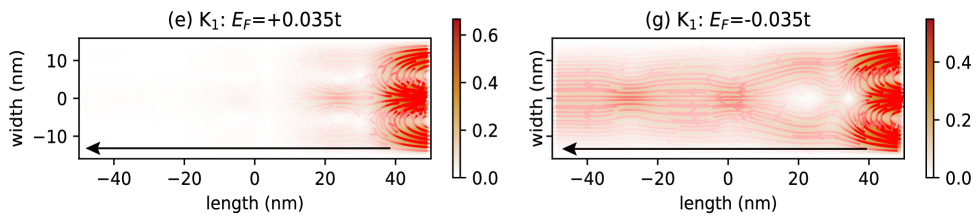
## Panel (e): K₁ with E_F = +0.035t
- **Axis Labels**:
- **X-axis**: `length (nm)` (range: -40 nm to +40 nm)
- **Y-axis**: `width (nm)` (range: -10 nm to +10 nm)
- **Color Bar**:
- **Range**: 0.0 (white) to 0.6 (dark red)
- **Label**: Intensity scale (no explicit units)
- **Key Observations**:
- **Red Intensity**: Concentrated on the right side of the plot (length > 20 nm).
- **Gradient**: Smooth transition from white (low intensity) to red (high intensity).
- **Symmetry**: Mirror-like pattern across the width axis (y = 0 nm).
## Panel (g): K₁ with E_F = -0.035t
- **Axis Labels**:
- **X-axis**: `length (nm)` (range: -40 nm to +40 nm)
- **Y-axis**: `width (nm)` (range: -10 nm to +10 nm)
- **Color Bar**:
- **Range**: 0.0 (white) to 0.6 (dark red)
- **Label**: Intensity scale (no explicit units)
- **Key Observations**:
- **Red Intensity**: Distributed across the entire plot with localized peaks near the edges (length ≈ ±40 nm).
- **Wave-like Patterns**: Oscillatory intensity variations along the length axis.
- **Asymmetry**: No mirror symmetry; intensity peaks are offset relative to the width axis.
## Cross-Referenced Legend Consistency
- **Color Bar Alignment**:
- Both panels use identical color scales (0.0–0.6), ensuring consistent intensity interpretation.
- Red regions in both panels correspond to values ≥ 0.4, as per the color bar.
## Summary of Trends
1. **Positive E_F (+0.035t)**:
- High-intensity regions are spatially confined to the right half of the plot.
- Suggests directional dependence of K₁ under positive E_F.
2. **Negative E_F (-0.035t)**:
- Intensity variations are more distributed, with edge-localized peaks.
- Indicates a different spatial modulation of K₁ under negative E_F.
## Diagram Components
- **Arrows**: Black arrows on the x-axis indicate the direction of increasing length.
- **Heatmap Grid**: Overlaid red/yellow lines represent intensity gradients.
- **Panel Titles**: Explicitly label the parameter conditions (K₁ and E_F values).
## Data Extraction Notes
- No explicit numerical data table is present; values are inferred from color intensity.
- Critical parameters: K₁ (dependent variable), E_F (independent variable with ±0.035t values).