## Bar Chart: Relative Power Across Components and Parameters
### Overview
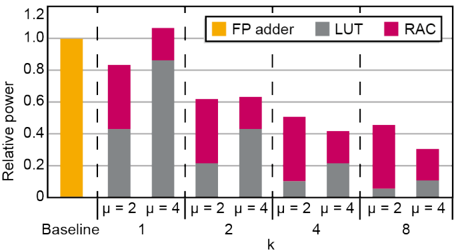
The chart compares the relative power of three components (FP adder, LUT, RAC) across different configurations labeled by `k` (1, 2, 4, 8) and parameter `μ` (2, 4). The Baseline represents a reference point. Relative power is normalized, with values ranging from 0 to 1.2 on the y-axis.
### Components/Axes
- **X-axis (Categories)**: Baseline, 1, 2, 4, 8 (each split into `μ=2` and `μ=4` subcategories).
- **Y-axis (Values)**: Relative power (0–1.2).
- **Legend**:
- Yellow: FP adder
- Gray: LUT
- Pink: RAC
- **Spatial Grounding**:
- Legend is top-right.
- Bars are grouped by `k`, with `μ=2` (left) and `μ=4` (right) within each group.
### Detailed Analysis
1. **Baseline**:
- FP adder: ~1.0 (yellow bar).
- LUT and RAC: Not present (no bars).
2. **k=1**:
- `μ=2`:
- FP adder: ~0.8 (yellow).
- LUT: ~0.4 (gray).
- RAC: ~0.4 (pink).
- `μ=4`:
- FP adder: ~0.9 (yellow).
- LUT: ~0.5 (gray).
- RAC: ~0.4 (pink).
3. **k=2**:
- `μ=2`:
- FP adder: ~0.6 (yellow).
- LUT: ~0.2 (gray).
- RAC: ~0.4 (pink).
- `μ=4`:
- FP adder: ~0.6 (yellow).
- LUT: ~0.4 (gray).
- RAC: ~0.2 (pink).
4. **k=4**:
- `μ=2`:
- FP adder: ~0.5 (yellow).
- LUT: ~0.1 (gray).
- RAC: ~0.4 (pink).
- `μ=4`:
- FP adder: ~0.5 (yellow).
- LUT: ~0.3 (gray).
- RAC: ~0.2 (pink).
5. **k=8**:
- `μ=2`:
- FP adder: ~0.3 (yellow).
- LUT: ~0.05 (gray).
- RAC: ~0.2 (pink).
- `μ=4`:
- FP adder: ~0.3 (yellow).
- LUT: ~0.1 (gray).
- RAC: ~0.15 (pink).
### Key Observations
- **Trend Verification**:
- All components show a **decreasing trend** as `k` increases (Baseline > k=1 > k=2 > k=4 > k=8).
- `μ=4` consistently outperforms `μ=2` for the same `k` (e.g., k=1: μ=4 FP adder ~0.9 vs. μ=2 ~0.8).
- **Component Hierarchy**:
- FP adder dominates across all configurations (highest values).
- LUT contributes minimally, especially at higher `k` (e.g., k=8: LUT ~0.05).
- RAC maintains a smaller but stable contribution (~0.15–0.4).
### Interpretation
- **Inverse Relationship**: Relative power decreases as `k` increases, suggesting higher `k` values reduce efficiency or increase resource demands.
- **Parameter Impact**: `μ=4` improves performance for FP adders and LUTs but has diminishing returns for RAC.
- **Component Roles**:
- FP adders are the primary power consumers, scaling down predictably with `k`.
- LUTs become negligible at higher `k`, while RAC remains a minor but consistent factor.
- **Anomalies**: No outliers; trends are consistent across all data points.
This chart highlights the trade-offs between configuration complexity (`k`), parameter scaling (`μ`), and component-specific power usage, emphasizing the FP adder’s dominance and the diminishing role of LUTs at higher `k`.