## Line Chart: Drive Level over Time for Knowledge Acquisition and Expression
### Overview
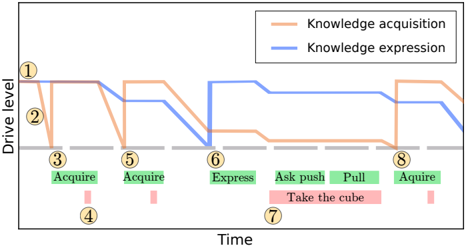
This image presents a line chart illustrating the drive level over time for two processes: knowledge acquisition and knowledge expression. The chart depicts fluctuations in drive levels associated with specific actions or events, labeled along the time axis. The chart appears to model a cognitive process, potentially in a robotic or AI system.
### Components/Axes
* **X-axis:** Labeled "Time". The scale is not explicitly defined, but it represents a progression of events.
* **Y-axis:** Labeled "Drive level". The scale is not explicitly defined, but it ranges from approximately 0 to 1.
* **Data Series:**
* "Knowledge acquisition" - Represented by a peach/orange colored line.
* "Knowledge expression" - Represented by a blue colored line.
* **Legend:** Located in the top-right corner, clearly associating colors with the data series.
* **Annotations:** Numbered circles (1-8) mark specific points on the chart, and text labels (Acquire, Express, Ask push, Take the cube, Pull) are placed below the time axis, corresponding to these points.
### Detailed Analysis
The chart shows the drive levels of both knowledge acquisition and expression changing over time.
* **Knowledge Acquisition (Peach/Orange Line):**
* Starts at approximately a drive level of 0.9 (Point 1).
* Decreases sharply to approximately 0.2 at Point 3 ("Acquire").
* Increases slightly to approximately 0.3 at Point 5 ("Acquire").
* Decreases to approximately 0.1 at Point 8 ("Acquire").
* Overall trend: Generally decreasing, with minor fluctuations.
* **Knowledge Expression (Blue Line):**
* Starts at approximately a drive level of 0.6 (Point 1).
* Decreases to approximately 0.3 at Point 3 ("Acquire").
* Increases sharply to approximately 0.8 at Point 6 ("Express").
* Decreases to approximately 0.5 at Point 7 ("Ask push/Take the cube").
* Remains relatively stable at approximately 0.5 until Point 8 ("Acquire").
* Overall trend: Fluctuating, with a significant peak at "Express".
The numbered points are as follows:
1. Drive level of Knowledge Acquisition: ~0.9, Knowledge Expression: ~0.6
2. Drive level of Knowledge Acquisition: ~0.3, Knowledge Expression: ~0.4
3. Drive level of Knowledge Acquisition: ~0.2, Knowledge Expression: ~0.3
4. Annotation: "Acquire"
5. Drive level of Knowledge Acquisition: ~0.3, Knowledge Expression: ~0.3
6. Drive level of Knowledge Acquisition: ~0.2, Knowledge Expression: ~0.8
7. Annotation: "Ask push/Take the cube"
8. Drive level of Knowledge Acquisition: ~0.1, Knowledge Expression: ~0.5
### Key Observations
* The "Express" event (Point 6) is associated with a significant increase in the drive level for knowledge expression.
* The "Acquire" events (Points 3, 5, and 8) are associated with decreases in the drive level for knowledge acquisition.
* The drive levels for knowledge acquisition are generally lower than those for knowledge expression throughout the observed period.
* The "Ask push/Take the cube" event (Point 7) causes a decrease in the drive level for knowledge expression.
### Interpretation
This chart likely represents a model of how an agent (potentially a robot or AI) learns and interacts with its environment. The "Knowledge acquisition" line suggests that acquiring new information or skills initially requires a high drive level, but this drive diminishes as the knowledge is obtained. The "Knowledge expression" line suggests that expressing knowledge (e.g., performing an action) requires a drive level that increases when the agent successfully expresses its knowledge, but decreases when it encounters challenges (e.g., needing to be asked how to perform a task).
The correlation between "Acquire" events and decreasing knowledge acquisition drive suggests a learning curve where the initial effort of acquiring knowledge is high, but the drive diminishes as the agent becomes more proficient. The peak in knowledge expression drive at "Express" indicates successful execution of a learned skill. The subsequent dip at "Ask push/Take the cube" suggests a need for further refinement or assistance, indicating a challenge in applying the acquired knowledge.
The chart demonstrates a dynamic interplay between knowledge acquisition and expression, where each process influences the other. The agent's drive levels fluctuate based on its success in acquiring and expressing knowledge, creating a feedback loop that drives learning and adaptation. The chart is a simplified model, but it provides insights into the cognitive processes that might underlie intelligent behavior.