## Line Graph: Drive Level Over Time
### Overview
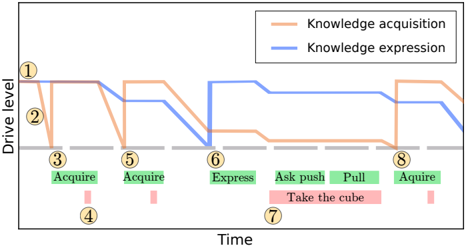
The image depicts a line graph illustrating the relationship between "Drive level" and "Time" across two knowledge processes: **Knowledge acquisition** (orange line) and **Knowledge expression** (blue line). The graph includes labeled events (e.g., "Acquire," "Express," "Take the cube") and numerical markers (1–8) to denote specific time points or actions.
---
### Components/Axes
- **X-axis (Time)**: Labeled "Time," with numerical markers at positions 1, 3, 5, 6, 7, and 8. These markers correspond to labeled events.
- **Y-axis (Drive level)**: Labeled "Drive level," with a horizontal baseline at the bottom of the graph.
- **Legend**: Located in the top-right corner, with:
- **Orange line**: "Knowledge acquisition"
- **Blue line**: "Knowledge expression"
---
### Detailed Analysis
#### Knowledge Acquisition (Orange Line)
- **Trend**: The orange line starts at a high drive level (1), drops sharply at time 3 ("Acquire"), rises again at time 5 ("Acquire"), drops at time 6 ("Express"), and remains low until time 8 ("Acquire").
- **Key Points**:
- Time 3: Sharp decline in drive level.
- Time 5: Partial recovery.
- Time 6: Further decline.
- Time 8: Final acquisition event.
#### Knowledge Expression (Blue Line)
- **Trend**: The blue line starts at a low drive level (1), rises sharply at time 6 ("Express"), remains elevated until time 8 ("Acquire"), then drops sharply.
- **Key Points**:
- Time 6: Sharp increase in drive level.
- Time 8: Sudden drop after acquisition.
#### Labeled Events
- **Time 3**: "Acquire" (orange line drop).
- **Time 5**: "Acquire" (orange line rise).
- **Time 6**: "Express" (blue line rise).
- **Time 7**: "Ask push," "Pull," and "Take the cube" (text block between lines).
- **Time 8**: "Acquire" (orange line rise, blue line drop).
---
### Key Observations
1. **Inverse Relationship**: Knowledge acquisition (orange) and expression (blue) exhibit opposing trends. For example:
- At time 6, "Express" causes a sharp rise in blue line (expression) and a drop in orange line (acquisition).
- At time 8, "Acquire" causes a rise in orange line but a drop in blue line.
2. **Event Clustering**: Time 7 includes three actions ("Ask push," "Pull," "Take the cube"), suggesting a critical interaction point.
3. **Baseline Drive Level**: The horizontal baseline (y=0) represents the minimum drive level, with all events occurring above it.
---
### Interpretation
- **Knowledge Dynamics**: The graph suggests that knowledge acquisition and expression are mutually inhibitory processes. For instance, expressing knowledge (blue line rise) suppresses acquisition (orange line drop), and vice versa.
- **Critical Events**: The "Take the cube" action at time 7 may represent a pivotal moment where knowledge is applied (expression) but also triggers a new acquisition phase (orange line recovery at time 8).
- **Uncertainty**: Exact numerical values for drive levels are not provided, but relative magnitudes (e.g., sharp rises/drops) are visually clear. The baseline (y=0) is assumed to represent zero drive.
---
### Structure of Textual Elements
- **Legend**: Top-right corner, clearly associating colors with processes.
- **Event Labels**: Positioned near time markers (e.g., "Acquire" at 3, 5, 8; "Express" at 6).
- **Action Block**: Text block at time 7 ("Ask push," "Pull," "Take the cube") is centrally placed between the two lines.
---
### Language and Transcription
- **Primary Language**: English (all labels, axis titles, and event descriptions are in English).
- **No Additional Languages**: No non-English text is present.
---
### Final Notes
The graph emphasizes the cyclical and antagonistic nature of knowledge acquisition and expression, with events acting as triggers for shifts in drive level. The "Take the cube" action at time 7 appears to be a narrative or operational milestone, linking expression (blue line) to subsequent acquisition (orange line).