## Line Chart: Accuracy Reward vs. Global Step for Different GRPO Methods
### Overview
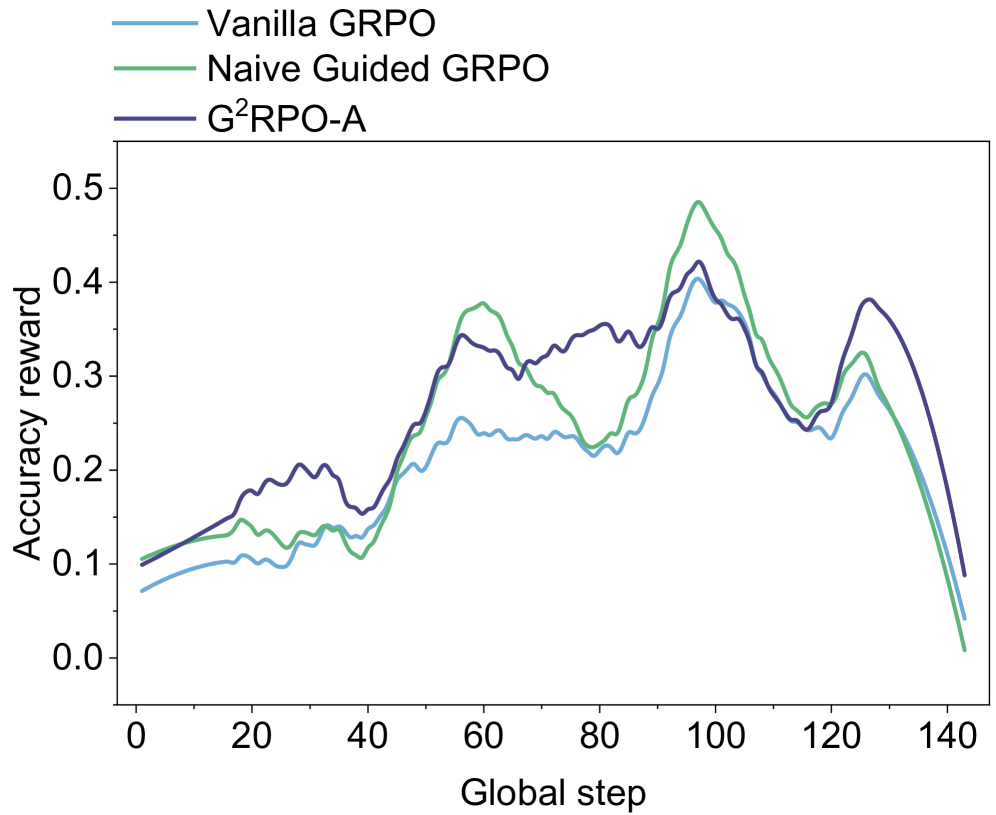
The image is a line chart comparing the accuracy reward of three different Guided Reinforcement Policy Optimization (GRPO) methods: Vanilla GRPO, Naive Guided GRPO, and G²RPO-A, over a range of global steps. The chart displays how the accuracy reward changes with the global step for each method.
### Components/Axes
* **X-axis:** Global step, with markers at intervals of 20, ranging from 0 to 140.
* **Y-axis:** Accuracy reward, ranging from 0.0 to 0.5, with markers at intervals of 0.1.
* **Legend (top-left):**
* Vanilla GRPO (light blue line)
* Naive Guided GRPO (light green line)
* G²RPO-A (dark blue line)
### Detailed Analysis
* **Vanilla GRPO (light blue line):**
* Trend: Initially increases slowly, plateaus around 0.2 between steps 40 and 80, then increases to approximately 0.25 around step 100, and decreases to approximately 0.05 at step 140.
* Data Points: Starts at approximately 0.07 at step 0, reaches approximately 0.25 at step 100, and ends at approximately 0.05 at step 140.
* **Naive Guided GRPO (light green line):**
* Trend: Starts low, increases to a peak around step 60, dips slightly, then rises to a higher peak around step 100, and decreases to approximately 0.0 at step 140.
* Data Points: Starts at approximately 0.1 at step 0, reaches approximately 0.37 at step 60, peaks at approximately 0.5 at step 100, and ends at approximately 0.0 at step 140.
* **G²RPO-A (dark blue line):**
* Trend: Starts low, increases to a peak around step 60, dips slightly, then rises to a higher peak around step 100, and decreases to approximately 0.05 at step 140.
* Data Points: Starts at approximately 0.11 at step 0, reaches approximately 0.38 at step 60, peaks at approximately 0.42 at step 100, and ends at approximately 0.05 at step 140.
### Key Observations
* The Naive Guided GRPO and G²RPO-A methods generally outperform Vanilla GRPO in terms of accuracy reward.
* All three methods experience a significant drop in accuracy reward towards the end of the global step range.
* The Naive Guided GRPO method achieves the highest peak accuracy reward around step 100.
* The G²RPO-A method has a more stable performance compared to the Naive Guided GRPO method, especially in the initial steps.
### Interpretation
The chart suggests that both Naive Guided GRPO and G²RPO-A are more effective than Vanilla GRPO in achieving higher accuracy rewards, particularly during the middle stages of the global step range. The eventual decline in accuracy reward for all methods indicates a potential limitation or instability in the learning process as the global step increases. The G²RPO-A method's relatively stable performance in the initial steps might indicate a more robust learning process compared to the Naive Guided GRPO method. The data implies that guiding the reinforcement policy optimization can lead to better performance, but further investigation is needed to understand the cause of the eventual decline in accuracy reward.