## Line Graph: Accuracy Reward vs. Global Step
### Overview
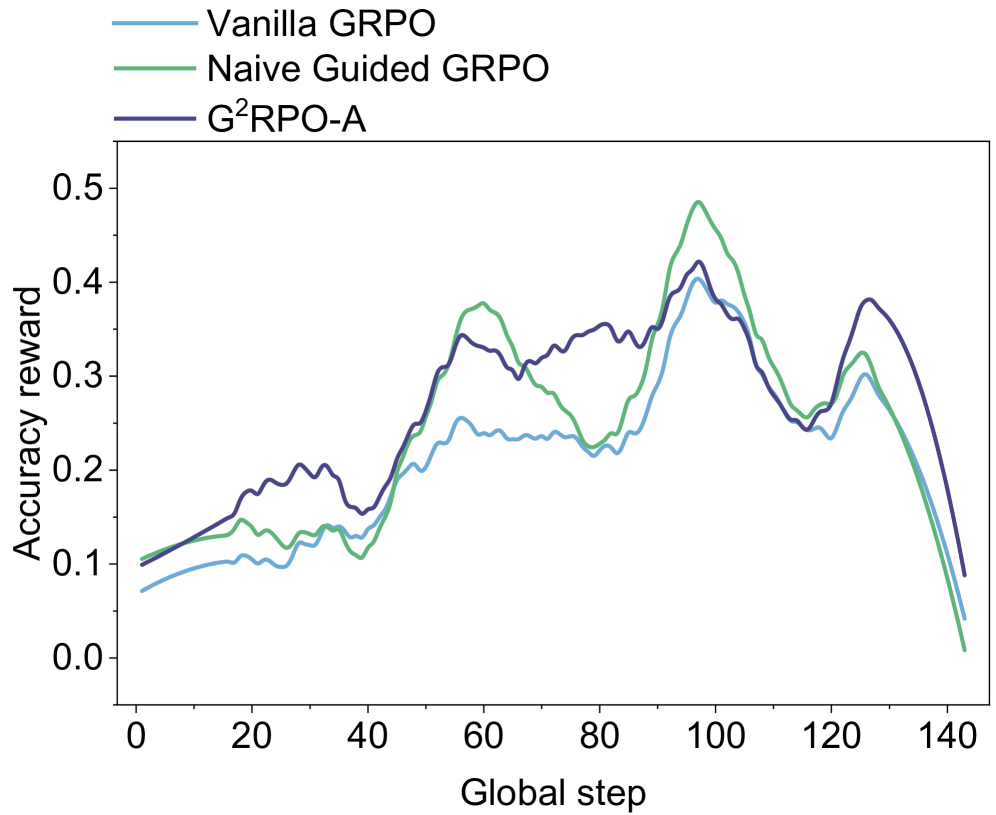
The image is a line graph comparing the accuracy reward of three reinforcement learning methods (Vanilla GRPO, Naive Guided GRPO, and G²RPO-A) across 140 global steps. The y-axis represents accuracy reward (0.0–0.5), and the x-axis represents global steps (0–140). Three colored lines (blue, green, purple) correspond to the methods in the legend.
### Components/Axes
- **X-axis (Global Step)**: Labeled "Global step," with ticks at 0, 20, 40, 60, 80, 100, 120, 140.
- **Y-axis (Accuracy Reward)**: Labeled "Accuracy reward," with ticks at 0.0, 0.1, 0.2, 0.3, 0.4, 0.5.
- **Legend**: Located at the top, with:
- **Blue**: Vanilla GRPO
- **Green**: Naive Guided GRPO
- **Purple**: G²RPO-A
### Detailed Analysis
1. **Vanilla GRPO (Blue)**:
- Starts at ~0.05 accuracy reward at step 0.
- Gradually increases to a peak of ~0.35 at step 100.
- Declines sharply to ~0.1 by step 140.
- Shows moderate fluctuations (e.g., minor dips at steps 40–60).
2. **Naive Guided GRPO (Green)**:
- Begins at ~0.1 at step 0.
- Rises to a peak of ~0.45 at step 100.
- Drops sharply to ~0.05 by step 140.
- Exhibits volatility (e.g., oscillations between 0.2–0.3 at steps 40–80).
3. **G²RPO-A (Purple)**:
- Starts at ~0.1 at step 0.
- Increases steadily to ~0.4 at step 100.
- Declines gradually to ~0.15 by step 140.
- Smoother trajectory with fewer fluctuations compared to others.
### Key Observations
- All three methods peak near step 100, but G²RPO-A maintains higher accuracy post-peak.
- Naive Guided GRPO has the highest peak (~0.45) but the steepest decline.
- Vanilla GRPO shows the most gradual rise and fall, with intermediate performance.
- No data points fall below 0.0 or exceed 0.5.
### Interpretation
The graph suggests that **G²RPO-A** outperforms the other methods in maintaining accuracy over time, particularly after the global step 100. The Naive Guided GRPO achieves the highest peak accuracy but suffers from instability, leading to a rapid decline. Vanilla GRPO demonstrates moderate performance with fewer fluctuations. The sharp drop in Naive Guided GRPO after step 100 may indicate overfitting or sensitivity to hyperparameters. The trends imply that G²RPO-A balances exploration and exploitation more effectively, making it robust for longer training durations.