## Diagram: Causal Diagram
### Overview
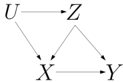
The image presents a causal diagram illustrating relationships between variables U, Z, X, and Y. The diagram uses arrows to indicate the direction of causal influence between these variables.
### Components/Axes
* **Nodes:** The diagram contains four nodes labeled U, Z, X, and Y.
* **Edges:** The diagram contains edges (arrows) indicating causal relationships. The arrows point from the cause to the effect.
* **Arrows:**
* U -> Z
* U -> X
* Z -> X
* Z -> Y
* X -> Y
### Detailed Analysis or Content Details
The diagram shows the following causal relationships:
* Variable U influences both Z and X.
* Variable Z influences both X and Y.
* Variable X influences Y.
### Key Observations
* U is a common cause of Z and X.
* Z is a common cause of X and Y.
* X is a direct cause of Y.
### Interpretation
The diagram represents a causal model where U affects Z and X, Z affects X and Y, and X affects Y. This model suggests that changes in U can indirectly affect Y through Z and X, and changes in Z can indirectly affect Y through X. The diagram is useful for understanding potential confounding variables and causal pathways in a system.