\n
## Diagram: Directed Graph
### Overview
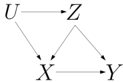
The image depicts a directed graph with six nodes labeled U, X, Y, Z, and two intermediate nodes. The graph illustrates relationships between these nodes through directed edges (arrows).
### Components/Axes
The diagram consists of nodes and directed edges. There are no explicit axes or scales. The nodes are labeled with single capital letters. The edges indicate a directional relationship from the source node to the destination node.
### Detailed Analysis or Content Details
The diagram shows the following relationships:
* U -> Z (U points to Z)
* U -> X (U points to X)
* Z -> Y (Z points to Y)
* X -> Y (X points to Y)
* X -> Z (X points to Z)
The graph forms a triangular structure with U at the top, and X and Z as intermediate nodes, both pointing to Y.
### Key Observations
The graph is acyclic, meaning there are no closed loops. Node Y has two incoming edges (from Z and X), making it a sink node. Node U has two outgoing edges (to Z and X), making it a source node. Node X has three outgoing edges (to Y, Z, and Z).
### Interpretation
This diagram likely represents a dependency graph, a workflow, or a causal relationship between the labeled entities. For example:
* U could represent an initial condition or input.
* X and Z could represent intermediate steps or processes.
* Y could represent a final outcome or output.
The multiple paths from U to Y (U -> Z -> Y and U -> X -> Y) suggest that there are multiple ways to achieve the outcome Y. The edge from X to Z indicates a feedback or iterative relationship between these two nodes. The diagram does not provide quantitative data, but rather a qualitative representation of relationships. It is a structural representation of connections, not a measurement of values.