## Violin Plot Grid: F1 Score Distributions by Training Condition and Phrase Presence
### Overview
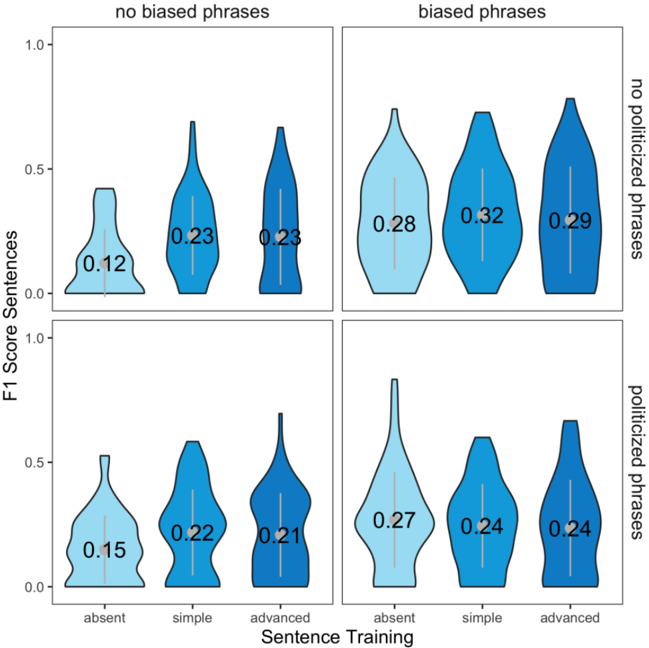
The image displays a 2x2 grid of violin plots comparing the distribution of F1 scores for sentences under different experimental conditions. The grid is organized by two binary factors: the presence of "biased phrases" (columns) and "politicized phrases" (rows). Each of the four subplots contains three violin plots representing different levels of "Sentence Training."
### Components/Axes
* **Overall Grid Structure:**
* **Columns (Top Labels):** Left column = "no biased phrases"; Right column = "biased phrases".
* **Rows (Right-side Labels):** Top row = "no politicized phrases"; Bottom row = "politicized phrases".
* **Y-Axis (Common to all subplots):** Labeled "F1 Score Sentences". Scale ranges from 0.0 to 1.0, with major ticks at 0.0, 0.5, and 1.0.
* **X-Axis (Bottom Label for entire grid):** Labeled "Sentence Training". Each subplot has three categorical positions:
* **Left:** "absent"
* **Center:** "simple"
* **Right:** "advanced"
* **Data Encoding:**
* **Violin Shape:** Shows the probability density of the F1 score data at different values. Wider sections indicate higher frequency.
* **Color:** Light blue for "absent", medium blue for "simple", dark blue for "advanced".
* **Internal Annotation:** A white horizontal line within each violin marks the median value, which is also written as a numerical label (e.g., "0.12").
### Detailed Analysis
**Subplot 1 (Top-Left): "no biased phrases" & "no politicized phrases"**
* **absent:** Light blue violin. Median F1 = **0.12**. Distribution is concentrated at the lower end, peaking below 0.25.
* **simple:** Medium blue violin. Median F1 = **0.23**. Distribution is wider, spanning roughly 0.0 to 0.7, with a peak around the median.
* **advanced:** Dark blue violin. Median F1 = **0.23**. Distribution shape is similar to "simple", spanning 0.0 to ~0.7.
**Subplot 2 (Top-Right): "biased phrases" & "no politicized phrases"**
* **absent:** Light blue violin. Median F1 = **0.28**. Distribution is broad, spanning 0.0 to ~0.8, with a peak near the median.
* **simple:** Medium blue violin. Median F1 = **0.32**. This is the highest median in the entire grid. Distribution is wide, spanning 0.0 to ~0.8.
* **advanced:** Dark blue violin. Median F1 = **0.29**. Distribution is similar to "simple", spanning 0.0 to ~0.8.
**Subplot 3 (Bottom-Left): "no biased phrases" & "politicized phrases"**
* **absent:** Light blue violin. Median F1 = **0.15**. Distribution is concentrated low, similar to the top-left "absent" but slightly higher.
* **simple:** Medium blue violin. Median F1 = **0.22**. Distribution spans ~0.0 to 0.6.
* **advanced:** Dark blue violin. Median F1 = **0.21**. Distribution spans ~0.0 to 0.7.
**Subplot 4 (Bottom-Right): "biased phrases" & "politicized phrases"**
* **absent:** Light blue violin. Median F1 = **0.27**. Distribution has a long tail extending upward to ~0.8.
* **simple:** Medium blue violin. Median F1 = **0.24**. Distribution spans ~0.0 to 0.6.
* **advanced:** Dark blue violin. Median F1 = **0.24**. Distribution spans ~0.0 to 0.7.
### Key Observations
1. **Impact of Biased Phrases:** The presence of biased phrases (right column) consistently leads to higher median F1 scores across all training levels compared to their absence (left column), most notably for the "absent" training condition.
2. **Impact of Politicized Phrases:** The effect is less consistent. For the "no biased phrases" condition (left column), adding politicized phrases (bottom row) results in slightly lower or similar F1 scores. For the "biased phrases" condition (right column), adding politicized phrases generally lowers the F1 scores, especially for "simple" and "advanced" training.
3. **Training Level Effect:** Moving from "absent" to "simple" training shows a clear improvement in median F1 in three of the four conditions (the exception being "biased phrases" + "politicized phrases"). The step from "simple" to "advanced" training shows minimal change in median F1 in all cases.
4. **Highest Performance:** The single highest median F1 score (**0.32**) is achieved with "simple" training in the presence of biased phrases but the absence of politicized phrases.
5. **Distribution Spread:** Violins in the "biased phrases" column generally show wider distributions, indicating greater variability in model performance compared to the "no biased phrases" column.
### Interpretation
This chart likely evaluates a model's performance (measured by F1 score) on sentence-level tasks under varying data conditions. The data suggests that:
* **Biased phrases are a stronger signal for the model** than politicized phrases, as their presence consistently boosts performance. This could mean the model finds biased language more distinctive or easier to learn from for the given task.
* **Politicized phrases have a more complex, often dampening effect.** They may introduce noise or complexity that interferes with the model's ability to leverage biased phrases effectively, as seen in the performance drop in the bottom-right quadrant.
* **Training has diminishing returns.** The most significant performance jump occurs when moving from no training ("absent") to "simple" training. "Advanced" training provides negligible benefit, suggesting the model's capacity or the task's complexity is saturated with simple training.
* **The optimal condition** for maximizing F1 score appears to be training on data containing biased phrases but not politicized phrases, using a "simple" training regimen. This implies a strategic data curation approach: including biased content while filtering out overtly politicized content may yield the best model performance for this specific evaluation metric.