## Scatter Plot: Sociology
### Overview
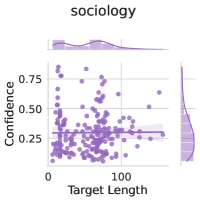
The image is a scatter plot titled "sociology", showing the relationship between "Target Length" on the x-axis and "Confidence" on the y-axis. The data points are represented by purple dots. There are density plots along the top and right edges of the scatter plot, showing the distribution of "Target Length" and "Confidence" respectively. A regression line with a shaded confidence interval is overlaid on the scatter plot.
### Components/Axes
* **Title:** sociology
* **X-axis:** Target Length
* Scale: 0 to 100
* **Y-axis:** Confidence
* Scale: 0.25 to 0.75
* **Data Points:** Purple dots representing individual data points.
* **Regression Line:** A purple line with a shaded purple confidence interval.
* **Density Plots:**
* Top: Density plot of Target Length.
* Right: Density plot of Confidence.
### Detailed Analysis
* **Target Length:** The x-axis ranges from 0 to 100.
* **Confidence:** The y-axis ranges from 0.25 to 0.75.
* **Data Distribution:** The data points are scattered across the plot. There appears to be a higher concentration of points at lower Target Length values.
* **Regression Line:** The regression line is nearly horizontal, suggesting a weak or non-existent correlation between Target Length and Confidence.
* **Density Plots:**
* The Target Length density plot shows a peak near the lower end of the scale, indicating that most data points have smaller Target Length values.
* The Confidence density plot shows a distribution with a peak around 0.25, indicating that most data points have lower Confidence values.
### Key Observations
* There is a weak or no correlation between Target Length and Confidence.
* Most data points have lower Target Length values.
* Most data points have lower Confidence values.
### Interpretation
The scatter plot suggests that there is little to no relationship between the "Target Length" and "Confidence" variables in the context of "sociology". The concentration of data points at lower Target Length values indicates that the dataset is skewed towards shorter targets. The low confidence values suggest that the model or process being evaluated has limited reliability or accuracy. The near-horizontal regression line reinforces the lack of correlation between the two variables.