\n
## Scatter Plot with Marginal Distributions: Sociology
### Overview
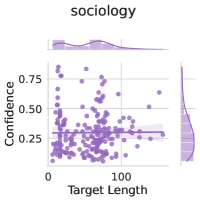
The image is a statistical visualization titled "sociology." It is a scatter plot with marginal distribution plots (density curves) on the top and right sides. The plot displays the relationship between "Target Length" on the horizontal axis and "Confidence" on the vertical axis for a dataset. The data points are rendered as semi-transparent purple circles, and a horizontal reference line is present.
### Components/Axes
* **Title:** "sociology" (centered at the top).
* **Main Chart Area:** A scatter plot.
* **X-Axis (Horizontal):**
* **Label:** "Target Length"
* **Scale:** Linear.
* **Visible Tick Markers:** "0" and "100". The axis extends slightly beyond 100.
* **Y-Axis (Vertical):**
* **Label:** "Confidence"
* **Scale:** Linear.
* **Visible Tick Markers:** "0.25", "0.50", "0.75".
* **Data Series:** A single series represented by purple circles. No explicit legend is present, as there is only one category.
* **Reference Line:** A solid, thin, dark purple horizontal line is drawn at approximately `Confidence = 0.25`.
* **Marginal Plots:**
* **Top Marginal Plot:** A density curve (smoothed histogram) showing the distribution of the "Target Length" variable. It is positioned directly above the main scatter plot, sharing the same x-axis.
* **Right Marginal Plot:** A density curve showing the distribution of the "Confidence" variable. It is positioned to the right of the main scatter plot, sharing the same y-axis. This plot is oriented vertically.
### Detailed Analysis
* **Data Point Distribution:**
* The data points are heavily concentrated in the region where `Target Length` is between approximately 0 and 50.
* Within this dense cluster, `Confidence` values show high variance, ranging from near 0.0 to above 0.75.
* As `Target Length` increases beyond 50, the density of points decreases significantly. Points become sparse.
* For `Target Length` values between 50 and ~150, the `Confidence` values appear to cluster more tightly, primarily between 0.25 and 0.50, with a few outliers above 0.50.
* **Marginal Distributions:**
* **Target Length (Top Plot):** The distribution is right-skewed. The peak density (mode) is at a very low `Target Length` (near 0). The density drops sharply as length increases, with a long tail extending to the right.
* **Confidence (Right Plot):** The distribution appears roughly unimodal with a peak near `Confidence = 0.25`. The density is highest around 0.25-0.35 and tapers off towards higher confidence values.
* **Reference Line:** The horizontal line at `Confidence ≈ 0.25` aligns closely with the peak of the Confidence marginal distribution and passes through the densest part of the scatter plot cluster.
### Key Observations
1. **Inverse Density Relationship:** There is a strong inverse relationship between the density of data points and `Target Length`. Short targets are abundant; long targets are rare.
2. **Variance Reduction:** The variance (spread) of `Confidence` appears to decrease as `Target Length` increases. Short targets are associated with highly variable confidence, while the few long targets show more consistent, moderate confidence.
3. **Central Tendency:** The horizontal reference line at 0.25 and the peak of the Confidence marginal plot suggest that the central tendency (likely the median or mode) for confidence in this dataset is around 0.25.
4. **Outliers:** A small number of data points exist with `Confidence` > 0.50 at `Target Length` > 50, which are outliers relative to the main cluster of long-target points.
### Interpretation
This visualization suggests a potential pattern in a sociological dataset (the specific context is not provided). The data indicates that **shorter "targets" (which could represent text length, interaction duration, or another metric) are far more common but are evaluated with highly variable confidence.** This could imply that short events or items are easier to encounter but harder to judge consistently.
Conversely, **longer "targets" are rare but are assessed with more consistent, moderate confidence (centered around 0.25).** This might suggest that when longer events or items do occur, they provide more stable cues for evaluation, leading to less variable confidence scores, albeit not necessarily high confidence.
The horizontal line at 0.25 may represent a baseline, chance level, or a significant threshold for confidence within this specific sociological model or measurement tool. The overall takeaway is that the length of the target variable is strongly associated with both the frequency of observation and the reliability (consistency) of the confidence measure.