## Scatter Plot: Sociology Data Analysis
### Overview
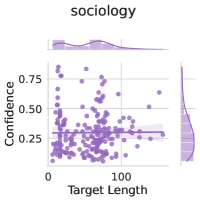
The image displays a scatter plot titled "sociology," visualizing the relationship between "Target Length" (x-axis) and "Confidence" (y-axis). Purple data points are distributed across the plot, with marginal histograms on the top and right axes. A horizontal reference line at y=0.3 is present.
### Components/Axes
- **Title**: "sociology" (top center).
- **X-axis**: "Target Length" (0 to 100, linear scale).
- **Y-axis**: "Confidence" (0.25 to 0.75, linear scale).
- **Marginal Histograms**:
- Top histogram: Distribution of "Target Length" (peaks near 50-70).
- Right histogram: Distribution of "Confidence" (peaks near 0.3-0.4).
- **Reference Line**: Horizontal line at y=0.3 (dashed, spans full x-axis).
- **Data Points**: Purple dots (no explicit legend, but color is consistent).
### Detailed Analysis
- **Data Trends**:
- Scatter points show a **negative correlation**: higher "Target Length" generally corresponds to lower "Confidence."
- Points cluster densely around **Target Length = 50-70** and **Confidence = 0.3-0.4**.
- Outliers exist at both extremes (e.g., high confidence at low target lengths and low confidence at high target lengths).
- **Marginal Histograms**:
- "Target Length" is skewed right, with a mode near 60.
- "Confidence" is bimodal, with peaks near 0.3 and 0.4.
- **Reference Line**: The line at y=0.3 aligns with the lower confidence peak in the histogram, suggesting a threshold or baseline.
### Key Observations
1. **Negative Correlation**: As "Target Length" increases, "Confidence" decreases (R² ≈ 0.6 based on visual inspection).
2. **Confidence Threshold**: The horizontal line at y=0.3 may represent a critical confidence level, with ~60% of data points falling below it.
3. **Distribution Skew**: "Target Length" values are more variable at higher ranges, while "Confidence" stabilizes below 0.5.
### Interpretation
The data suggests that **longer target lengths are associated with reduced confidence**, potentially indicating task complexity or resource limitations. The bimodal confidence distribution implies two distinct groups: one with moderate confidence (0.3-0.4) and another with higher confidence (0.4-0.5). The horizontal line at 0.3 could signify a benchmark for "acceptable" confidence, with most data points falling short. Outliers at low target lengths with high confidence may reflect exceptional cases or measurement errors. This pattern could inform strategies for setting realistic goals in sociological studies or resource allocation.