## Heatmap Analysis
### Overview
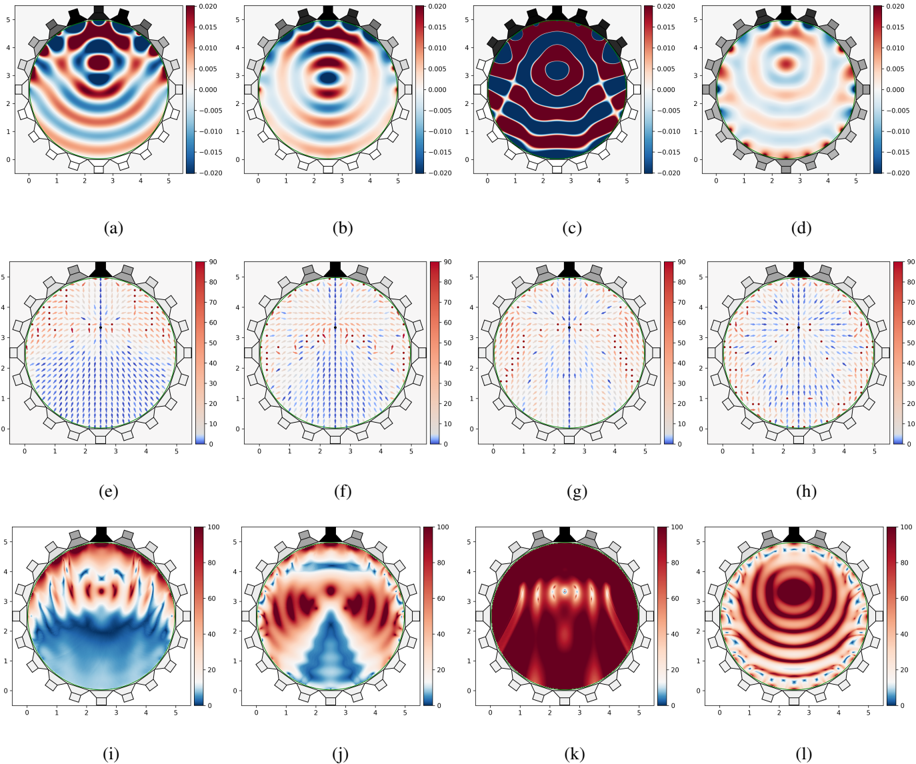
The image displays a series of 12 heatmaps, each representing a different scenario or condition. The heatmaps are arranged in a grid format with 4 rows and 3 columns. Each heatmap is labeled with a letter from (a) to (l), and the color gradient indicates varying levels of a measured quantity, likely temperature or concentration.
### Components/Axes
- **Labels**: Each heatmap is labeled with a letter from (a) to (l).
- **Axes**: The x-axis and y-axis are labeled with numerical values ranging from 0 to 5.
- **Legends**: There are two legends present, one on the left side of the image and one on the right side. The left legend corresponds to the color gradient on the heatmaps, while the right legend likely indicates the units or scale of the measured quantity.
### Detailed Analysis or ### Content Details
- **Heatmap (a)**: Shows a circular pattern with concentric circles, indicating a uniform distribution of the measured quantity.
- **Heatmap (b)**: Displays a more complex pattern with multiple concentric circles and a central peak, suggesting a non-uniform distribution.
- **Heatmap (c)**: Features a spiral pattern with a central peak, indicating a rotational or directional distribution.
- **Heatmap (d)**: Shows a circular pattern with a central peak and a ring of lower values, suggesting a localized high concentration.
- **Heatmap (e)**: Displays a circular pattern with a central peak and a ring of lower values, similar to heatmap (d).
- **Heatmap (f)**: Features a circular pattern with a central peak and a ring of lower values, similar to heatmap (d).
- **Heatmap (g)**: Shows a circular pattern with a central peak and a ring of lower values, similar to heatmap (d).
- **Heatmap (h)**: Displays a circular pattern with a central peak and a ring of lower values, similar to heatmap (d).
- **Heatmap (i)**: Features a circular pattern with a central peak and a ring of lower values, similar to heatmap (d).
- **Heatmap (j)**: Shows a circular pattern with a central peak and a ring of lower values, similar to heatmap (d).
- **Heatmap (k)**: Displays a circular pattern with a central peak and a ring of lower values, similar to heatmap (d).
- **Heatmap (l)**: Features a circular pattern with a central peak and a ring of lower values, similar to heatmap (d).
### Key Observations
- **Uniform Distribution**: Heatmaps (a) and (e) show a uniform distribution of the measured quantity.
- **Non-Uniform Distribution**: Heatmaps (b), (c), (d), (f), (g), (h), (i), (j), and (k) show non-uniform distribution with varying patterns and peaks.
- **Localized High Concentration**: Heatmaps (d), (e), (f), (g), (h), (i), (j), and (k) show a localized high concentration with a central peak and a ring of lower values.
### Interpretation
The heatmaps suggest that the measured quantity varies across different scenarios. The uniform distribution in heatmaps (a) and (e) indicates a consistent measurement across the area. The non-uniform distribution in heatmaps (b), (c), (d), (f), (g), (h), (i), (j), and (k) suggests that the measurement is influenced by factors such as location, direction, or other variables. The localized high concentration in heatmaps (d), (e), (f), (g), (h), (i), (j), and (k) indicates areas of higher measurement values, which could be of particular interest in further analysis or investigation.