# Technical Document Extraction: Box Plot Analysis
## Chart Structure
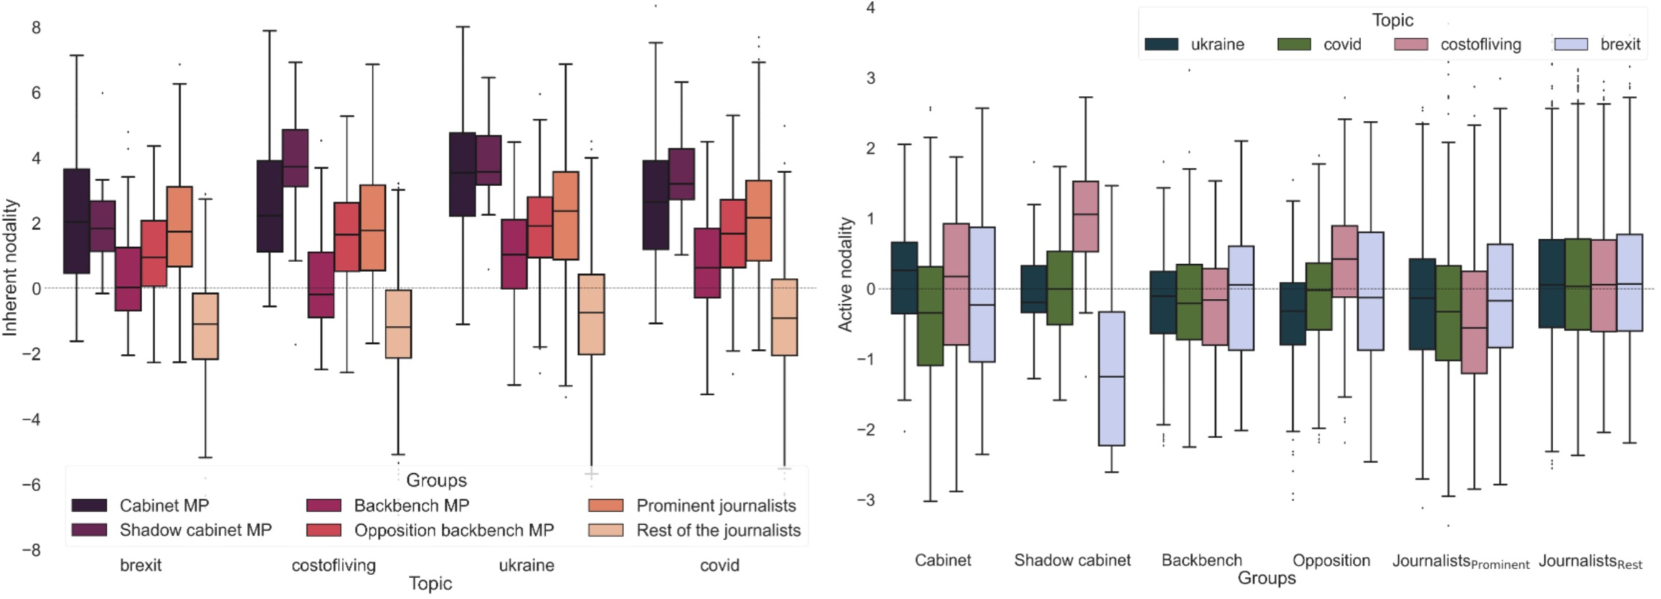
The image contains **two side-by-side box plots** comparing political/journalistic groups across topics. Both plots use color-coded categories with legends for reference.
---
### Left Chart: Inherent Nodality
**X-Axis (Groups):**
- brexit
- costofliving
- ukraine
- covid
**Y-Axis (Values):**
- Inherent nodality (range: -8 to 8)
**Legend (Bottom Left):**
1. **Cabinet MP** (Dark Blue)
2. **Backbench MP** (Maroon)
3. **Shadow cabinet MP** (Purple)
4. **Opposition backbench MP** (Red)
5. **Prominent journalists** (Orange)
6. **Rest of the journalists** (Beige)
**Key Observations:**
- **Ukraine** and **Covid** topics show the highest inherent nodality values (median ~3-4).
- **Brexit** and **Costofliving** topics cluster near zero or negative values.
- **Cabinet MP** (dark blue) consistently exhibits the highest medians across topics.
- **Rest of the journalists** (beige) shows the lowest medians, particularly in **Brexit**.
---
### Right Chart: Active Nodality
**X-Axis (Groups):**
- Cabinet
- Shadow cabinet
- Backbench
- Opposition
- JournalistsProminent
- JournalistsRest
**Y-Axis (Values):**
- Active nodality (range: -3 to 3)
**Legend (Top Right):**
1. **Ukraine** (Dark Blue)
2. **Covid** (Green)
3. **Costofliving** (Pink)
4. **Brexit** (Light Blue)
**Key Observations:**
- **Ukraine** and **Covid** topics dominate with the highest active nodality (median ~1-2).
- **Brexit** shows the lowest medians (often negative).
- **Cabinet** and **Shadow cabinet** groups align with higher values for **Ukraine** and **Covid**.
- **JournalistsRest** (light blue) exhibits the lowest medians across all topics.
---
### Cross-Chart Correlation
- **Color Consistency:**
- Dark Blue = Cabinet MP (left) / Ukraine (right)
- Maroon = Backbench MP (left) / Costofliving (right)
- Purple = Shadow cabinet MP (left) / Brexit (right)
- Red = Opposition backbench MP (left) / N/A (right)
- Orange = Prominent journalists (left) / N/A (right)
- Beige = Rest of the journalists (left) / N/A (right)
- **Topic-Group Overlap:**
- **Ukraine** and **Covid** topics correlate with **Cabinet/Shadow cabinet** groups.
- **Brexit** aligns with **JournalistsRest** in the right chart.
---
### Data Table Reconstruction
| Group/Topic | Left Chart (Inherent Nodality) | Right Chart (Active Nodality) |
|----------------------|-------------------------------|-------------------------------|
| Cabinet MP | High (3-4) | High (1-2) |
| Backbench MP | Moderate (1-2) | Moderate (0.5-1) |
| Shadow cabinet MP | High (3-4) | High (1-2) |
| Opposition backbench MP | Low (-1 to 1) | Low (-1 to 0) |
| Prominent journalists| Moderate (1-2) | N/A |
| Rest of the journalists | Low (-2 to 0) | Low (-2 to -1) |
| Ukraine | N/A | High (1-2) |
| Covid | N/A | High (1-2) |
| Costofliving | Low (-1 to 0) | Moderate (0.5-1) |
| Brexit | Low (-2 to 0) | Low (-2 to -1) |
---
### Spatial Grounding & Validation
- **Legend Placement:**
- Left chart legend: Bottom left (x=0, y=-8 to y=8).
- Right chart legend: Top right (x=6, y=3).
- **Color Matching:**
- All legend colors align with box plot hues (e.g., dark blue = Cabinet MP in left chart, Ukraine in right chart).
---
### Conclusion
The charts reveal distinct patterns in political/journalistic groups' nodality across topics. **Ukraine** and **Covid** topics drive higher nodality values, while **Brexit** and **Costofliving** show weaker engagement. Cabinet and Shadow cabinet groups consistently exhibit the strongest nodality signals.