\n
## Line Chart: Training Performance Metrics
### Overview
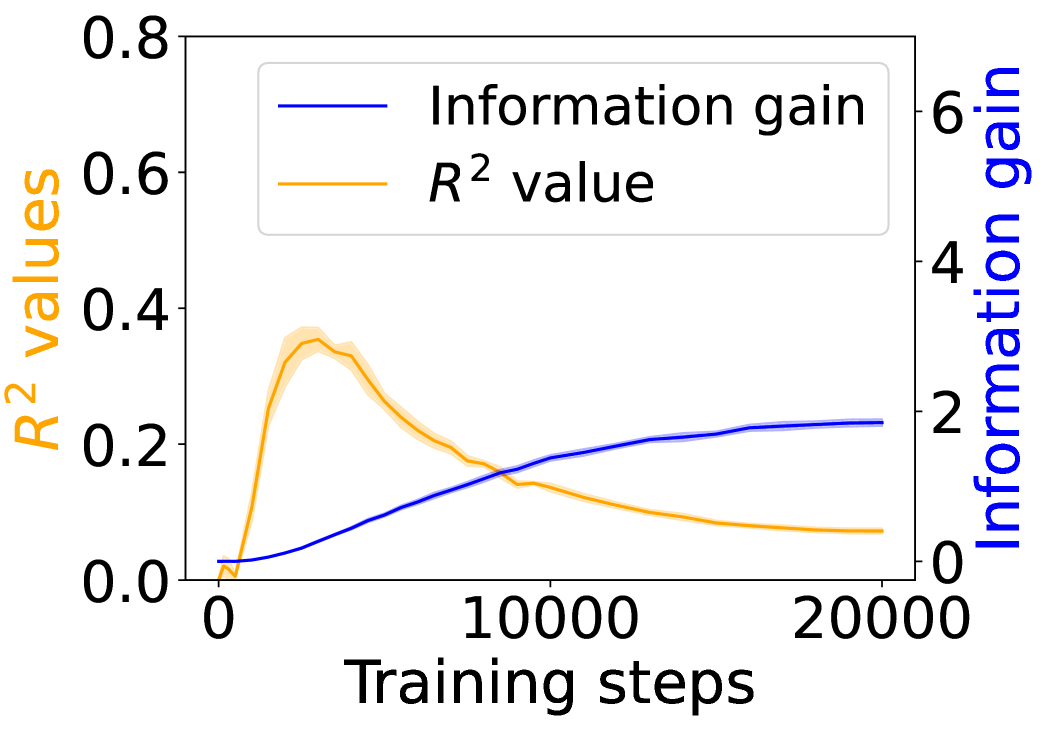
This image presents a line chart illustrating the relationship between training steps and two performance metrics: Information Gain and R² value. The chart appears to track the progress of a machine learning model during training. The chart uses a dual y-axis to display both metrics simultaneously.
### Components/Axes
* **X-axis:** "Training steps" ranging from approximately 0 to 20000.
* **Left Y-axis:** "R² values" ranging from 0.0 to 0.8.
* **Right Y-axis:** "Information gain" ranging from 0 to 6.
* **Legend:** Located in the top-left corner, identifying two lines:
* "Information gain" (Blue line)
* "R² value" (Orange line)
### Detailed Analysis
**R² Value (Orange Line):**
The orange line representing the R² value starts at approximately 0.0 at 0 training steps. It rapidly increases to a peak of approximately 0.45 at around 2000 training steps. After the peak, it declines, oscillating between approximately 0.15 and 0.25, eventually settling around 0.18 at 20000 training steps. The trend is initially strongly upward, then becomes more erratic with a general downward slope.
**Information Gain (Blue Line):**
The blue line representing Information Gain starts at approximately 0.0 at 0 training steps. It exhibits a slow, steady increase throughout the entire training period, reaching a value of approximately 2.3 at 20000 training steps. The trend is consistently upward, though the rate of increase diminishes over time.
**Data Points (Approximate):**
| Training Steps | R² Value (Approx.) | Information Gain (Approx.) |
|----------------|--------------------|---------------------------|
| 0 | 0.0 | 0.0 |
| 2000 | 0.45 | 0.6 |
| 5000 | 0.25 | 1.2 |
| 10000 | 0.20 | 1.8 |
| 15000 | 0.18 | 2.1 |
| 20000 | 0.18 | 2.3 |
### Key Observations
* The R² value peaks early in training and then plateaus and fluctuates.
* Information Gain consistently increases throughout the training process.
* The scales on the y-axes are different, which is important to note when interpreting the relative magnitudes of the changes in each metric.
* The R² value shows signs of overfitting or diminishing returns after the initial increase.
### Interpretation
The chart suggests that the model initially learns quickly, as indicated by the rapid increase in the R² value. However, this learning appears to slow down and potentially reverse after a certain point, possibly due to overfitting or reaching the limits of the model's capacity to capture the underlying patterns in the data. The consistent increase in Information Gain suggests that the model continues to gain new information throughout the training process, even as the R² value plateaus. This could indicate that the model is becoming more complex but not necessarily more accurate in its predictions. The divergence between the two metrics suggests a trade-off between model complexity and generalization performance. Further investigation might be needed to determine the optimal training duration or to explore techniques for preventing overfitting.