## Scatter Plot: t-SNE of synthetic tools by Category
### Overview
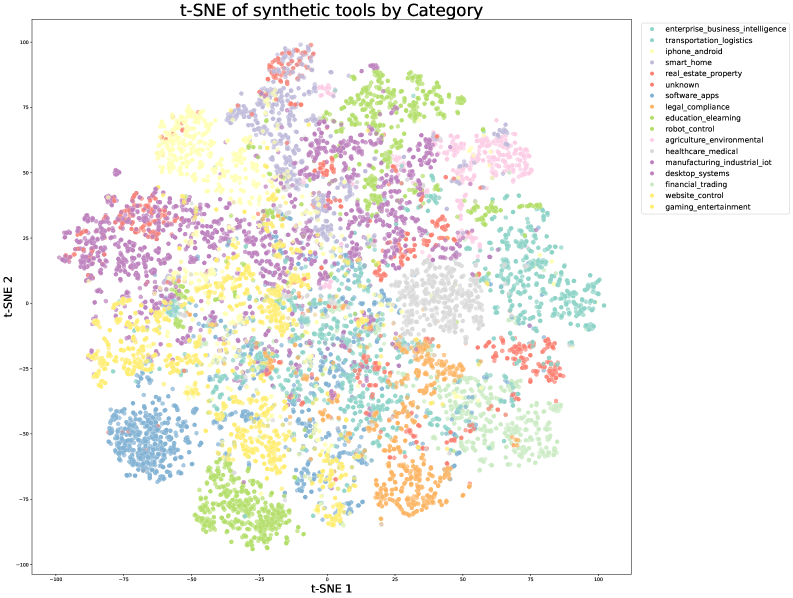
The image is a scatter plot visualizing the t-distributed stochastic neighbor embedding (t-SNE) of synthetic tools, categorized by different labels. Each point on the plot represents a tool, and the color of the point indicates its category. The plot aims to reduce the dimensionality of the data while preserving the local structure, allowing for visualization of clusters and relationships between different categories of tools.
### Components/Axes
* **Title:** t-SNE of synthetic tools by Category
* **X-axis:** t-SNE 1, with a scale from approximately -100 to 100, marked at -100, -75, -50, -25, 0, 25, 50, 75, and 100.
* **Y-axis:** t-SNE 2, with a scale from approximately -100 to 100, marked at -100, -75, -50, -25, 0, 25, 50, 75, and 100.
* **Legend:** Located on the right side of the plot, listing the categories and their corresponding colors:
* enterprise\_business\_intelligence (light blue)
* transportation\_logistics (dark blue)
* iphone\_android (red)
* smart\_home (pink)
* real\_estate\_property (coral)
* unknown (grey)
* software\_apps (purple)
* legal\_compliance (dark green)
* education\_elearning (light green)
* robot\_control (lime green)
* agriculture\_environmental (teal)
* healthcare\_medical (light orange)
* manufacturing\_industrial\_iot (dark purple)
* desktop\_systems (lavender)
* financial\_trading (dark cyan)
* website\_control (yellow)
* gaming\_entertainment (light yellow)
### Detailed Analysis
The scatter plot shows the distribution of data points across the t-SNE 1 and t-SNE 2 axes, with each point colored according to its category. The points form several distinct clusters, suggesting that tools within the same category tend to have similar characteristics in the reduced-dimensional space.
* **enterprise\_business\_intelligence (light blue):** Forms a cluster in the bottom-left quadrant.
* **transportation\_logistics (dark blue):** Forms a cluster in the bottom-left quadrant, slightly above the "enterprise\_business\_intelligence" cluster.
* **iphone\_android (red):** Forms a cluster in the top-right quadrant.
* **smart\_home (pink):** Forms a cluster in the top-right quadrant, near the "iphone\_android" cluster.
* **real\_estate\_property (coral):** Forms a cluster in the top-right quadrant, slightly below the "iphone\_android" and "smart\_home" clusters.
* **unknown (grey):** Forms a cluster in the center of the plot.
* **software\_apps (purple):** Forms a cluster in the top-left quadrant.
* **legal\_compliance (dark green):** Forms a cluster in the top-center region.
* **education\_elearning (light green):** Forms a cluster in the center-left region.
* **robot\_control (lime green):** Forms a cluster in the bottom-center region.
* **agriculture\_environmental (teal):** Forms a cluster in the center-right region.
* **healthcare\_medical (light orange):** Forms a cluster in the center-right region, near the "agriculture\_environmental" cluster.
* **manufacturing\_industrial\_iot (dark purple):** Forms a cluster in the top-left quadrant, near the "software\_apps" cluster.
* **desktop\_systems (lavender):** Forms a cluster in the top-left quadrant, near the "software_apps" and "manufacturing_industrial_iot" clusters.
* **financial\_trading (dark cyan):** Forms a cluster in the bottom-right quadrant.
* **website\_control (yellow):** Forms a cluster in the bottom-center region.
* **gaming\_entertainment (light yellow):** Forms a cluster in the bottom-center region, near the "website\_control" cluster.
### Key Observations
* The t-SNE plot reveals distinct clusters for different categories of synthetic tools, indicating that the tools within each category share similar characteristics in the reduced-dimensional space.
* Some categories, such as "enterprise\_business\_intelligence" and "transportation\_logistics," are located close to each other, suggesting a potential relationship or overlap in their features.
* The "unknown" category forms a cluster in the center of the plot, which may indicate that these tools do not have strong distinguishing features or that they are a mix of different categories.
### Interpretation
The t-SNE plot provides a visual representation of the relationships between different categories of synthetic tools. The clustering of points suggests that the t-SNE algorithm has successfully captured the underlying structure of the data, allowing for the identification of groups of tools with similar characteristics. This visualization can be used to gain insights into the relationships between different categories of tools, identify potential areas of overlap or similarity, and explore the characteristics of tools within each category. The "unknown" category's central location suggests a lack of clear categorization, potentially indicating a need for further analysis or refinement of the categorization process.