## t-SNE Plot: Synthetic Tools by Category
### Overview
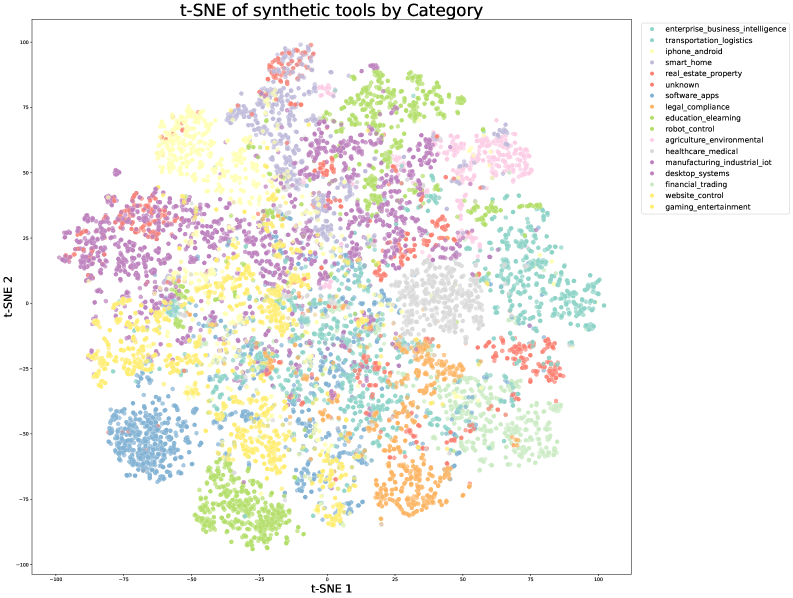
The image is a t-SNE (t-distributed Stochastic Neighbor Embedding) visualization of synthetic tools categorized by domain. The plot uses two principal components (t-SNE 1 and t-SNE 2) to represent high-dimensional data in 2D space. Each point represents a synthetic tool, colored by its associated category. The legend on the right maps 15 categories to distinct colors.
### Components/Axes
- **Axes**:
- X-axis: t-SNE 1 (range: -100 to 100)
- Y-axis: t-SNE 2 (range: -100 to 100)
- **Legend**:
- Positioned on the right, with 15 categories mapped to colors (e.g., `enterprise_business_intelligence` = light blue, `transportation_logistics` = teal, `iphone_android` = yellow, etc.).
- Includes an "unknown" category (gray) and a "gaming_entertainment" category (bright yellow).
### Detailed Analysis
- **Data Distribution**:
- **Bottom-left quadrant** (t-SNE 1 < -50, t-SNE 2 < -50): Dominated by `education_e-learning` (green) and `software_apps` (blue).
- **Top-left quadrant** (t-SNE 1 < -50, t-SNE 2 > 50): Clustered `iphone_android` (yellow) and `smart_home` (purple).
- **Top-right quadrant** (t-SNE 1 > 50, t-SNE 2 > 50): Concentrated `real_estate_property` (red) and `agriculture_environmental` (pink).
- **Bottom-right quadrant** (t-SNE 1 > -50, t-SNE 2 < -50): Spread of `financial_trading` (orange) and `robot_control` (dark green).
- **Center**: Mixed clusters of `healthcare_medical` (light gray), `manufacturing_industrial_iot` (dark purple), and `legal_compliance` (orange).
- **Outliers**:
- `desktop_systems` (dark purple) and `website_control` (bright yellow) appear scattered across all quadrants.
- `unknown` (gray) points are dispersed throughout the plot, suggesting unclassified or ambiguous tools.
### Key Observations
1. **Clustering Patterns**:
- `iphone_android` (yellow) and `real_estate_property` (red) form tight clusters, indicating high similarity within their categories.
- `education_e-learning` (green) and `software_apps` (blue) are tightly grouped but separated from other domains.
2. **Dispersion**:
- `unknown` (gray) and `desktop_systems` (dark purple) show the widest dispersion, suggesting heterogeneity or overlap with multiple categories.
3. **Color Consistency**:
- All legend colors match their corresponding data points (e.g., `transportation_logistics` = teal, `legal_compliance` = orange).
### Interpretation
The t-SNE plot reveals distinct groupings of synthetic tools by domain, with some categories (e.g., `iphone_android`, `real_estate_property`) exhibiting strong internal cohesion. The widespread distribution of `unknown` and `desktop_systems` suggests either ambiguous categorization or tools that span multiple domains. The separation of `education_e-learning` and `software_apps` from other categories implies these tools may have unique characteristics or applications. The plot highlights the need for further analysis to resolve overlaps and refine category definitions, particularly for the "unknown" group.