## Bar Chart: Layer Importance via Single-Layer Ablation
### Overview
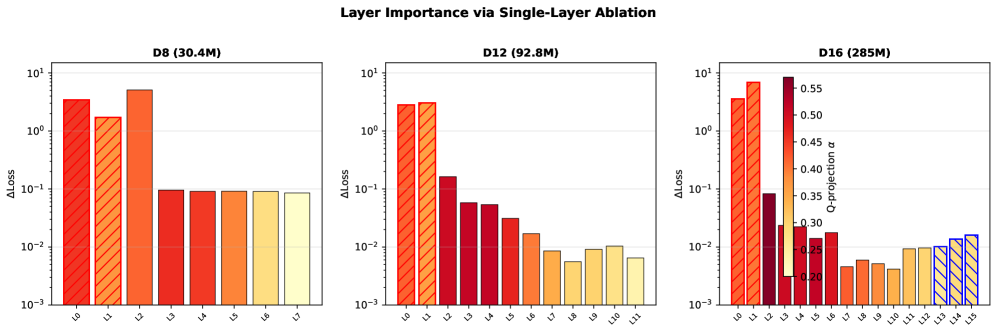
The image contains three bar charts comparing layer importance across different model sizes (D8, D12, D16) via single-layer ablation. Each chart visualizes the impact of removing individual layers on model performance, measured as ΔLoss (absolute loss change). The y-axis uses a logarithmic scale (10^-3 to 10^1), and the x-axis lists layers (L0 to L7/L11/L15). Color-coded bars represent three metrics: "Q-projection" (solid red), "α" (gradient red-orange), and "β" (striped yellow-blue).
### Components/Axes
- **Y-Axis**: ΔLoss (log scale: 10^-3, 10^-2, 10^-1, 10^0, 10^1)
- **X-Axis**: Layers (L0 to L7 for D8, L0 to L11 for D12, L0 to L15 for D16)
- **Legend**:
- **Q-projection**: Solid red bars
- **α**: Gradient red-orange bars (color intensity varies)
- **β**: Striped yellow-blue bars
- **Chart Titles**:
- D8 (30.4M)
- D12 (92.8M)
- D16 (285M)
### Detailed Analysis
#### D8 (30.4M)
- **L0**: ΔLoss ≈ 5 (solid red)
- **L1**: ΔLoss ≈ 3 (gradient red-orange)
- **L2**: ΔLoss ≈ 8 (solid red)
- **L3–L7**: ΔLoss ≈ 0.1–0.5 (gradient red-orange and striped yellow-blue)
#### D12 (92.8M)
- **L0**: ΔLoss ≈ 5 (solid red)
- **L1**: ΔLoss ≈ 3 (gradient red-orange)
- **L2**: ΔLoss ≈ 2 (solid red)
- **L3–L11**: ΔLoss ≈ 0.05–0.5 (gradient red-orange and striped yellow-blue)
#### D16 (285M)
- **L0**: ΔLoss ≈ 5 (solid red)
- **L1**: ΔLoss ≈ 3 (gradient red-orange)
- **L2–L15**: ΔLoss ≈ 0.05–0.5 (gradient red-orange and striped yellow-blue)
### Key Observations
1. **Layer Importance**: Early layers (L0, L1) consistently show the highest ΔLoss across all models, indicating critical importance.
2. **Model Size Correlation**: Larger models (D16) exhibit more gradual ΔLoss declines compared to smaller models (D8), suggesting deeper layers contribute more in larger architectures.
3. **Metric Differentiation**:
- **Q-projection** (solid red) dominates in early layers (L0–L2).
- **α** (gradient) and **β** (striped) dominate in later layers (L3+).
4. **Logarithmic Scale Impact**: The y-axis compresses large ΔLoss values (e.g., L0–L2) and emphasizes smaller changes in deeper layers.
### Interpretation
- **Model Architecture Insights**: Early layers (L0–L2) are critical for all models, likely handling foundational feature extraction. Deeper layers (L3+) show diminishing returns, with larger models (D16) leveraging more layers for nuanced tasks.
- **Metric Roles**:
- **Q-projection** (solid red) may represent direct input-output relationships, critical in early stages.
- **α** (gradient) and **β** (striped) could denote auxiliary components (e.g., attention mechanisms, normalization) that gain importance in deeper layers.
- **Anomalies**: The striped "β" bars in D16 (L14–L15) show unexpectedly high ΔLoss (~0.1), suggesting potential over-reliance on these layers in the largest model.
This analysis highlights the trade-off between model size and layer efficiency, with implications for optimizing architectures by prioritizing critical layers.