## Bar Chart: Fraction of Critical and Random Tokens vs. Average Accuracy
### Overview
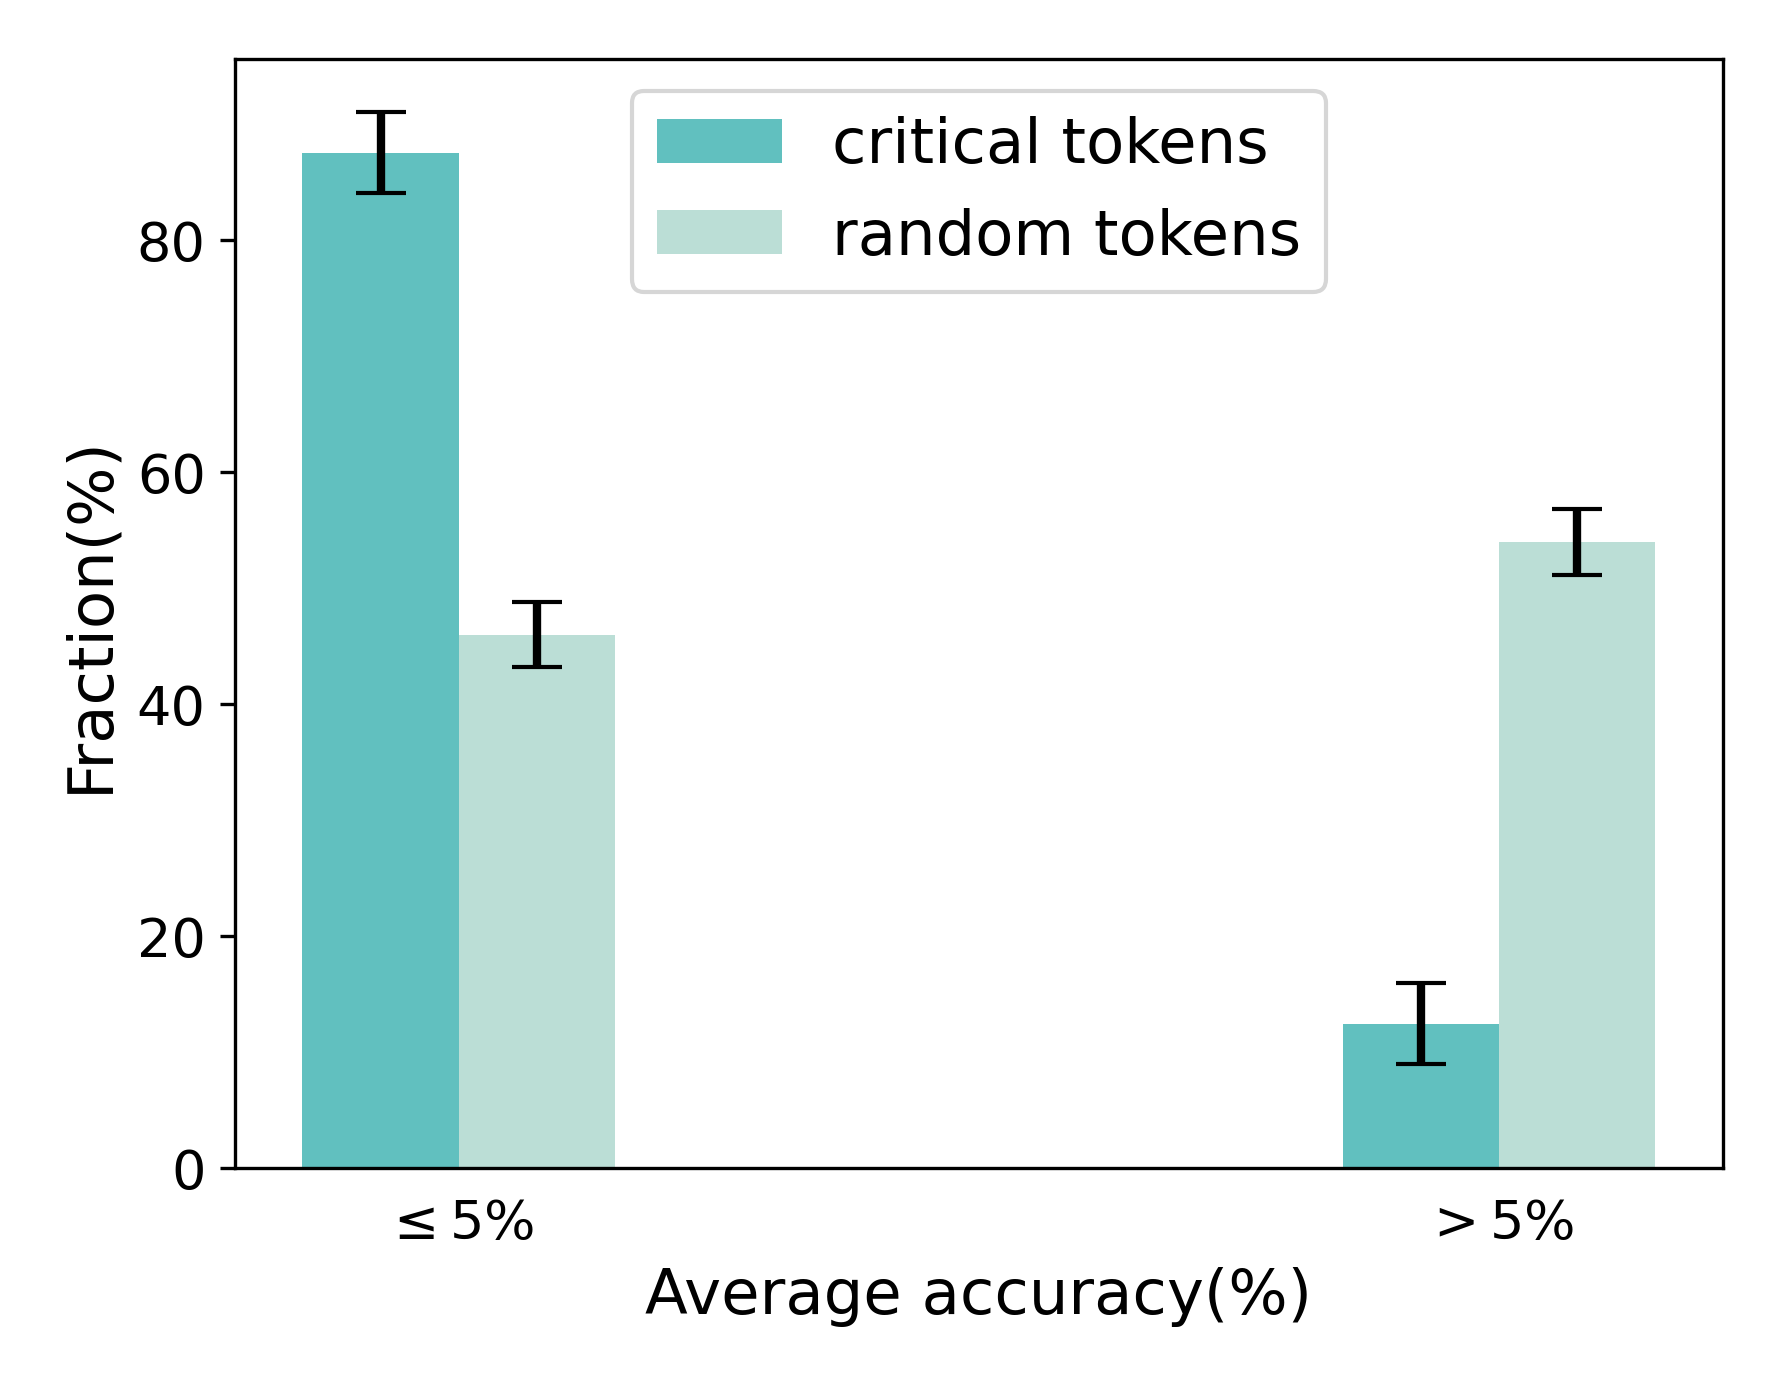
The image is a bar chart comparing the fraction (percentage) of "critical tokens" and "random tokens" at two different levels of average accuracy: "≤ 5%" and "> 5%". Error bars are included on each bar, indicating variability.
### Components/Axes
* **X-axis:** Average accuracy (%), with two categories: "≤ 5%" and "> 5%".
* **Y-axis:** Fraction (%), ranging from 0 to 80, with tick marks at 0, 20, 40, 60, and 80.
* **Legend:** Located at the top-right of the chart.
* "critical tokens" - Represented by a teal/cyan color.
* "random tokens" - Represented by a light green/mint color.
### Detailed Analysis
* **Average Accuracy ≤ 5%:**
* **Critical Tokens (Teal):** Fraction is approximately 87% with an error bar extending from approximately 84% to 90%.
* **Random Tokens (Light Green):** Fraction is approximately 46% with an error bar extending from approximately 43% to 49%.
* **Average Accuracy > 5%:**
* **Critical Tokens (Teal):** Fraction is approximately 13% with an error bar extending from approximately 10% to 16%.
* **Random Tokens (Light Green):** Fraction is approximately 54% with an error bar extending from approximately 51% to 57%.
### Key Observations
* For average accuracy ≤ 5%, critical tokens have a significantly higher fraction than random tokens.
* For average accuracy > 5%, random tokens have a significantly higher fraction than critical tokens.
* The fraction of critical tokens decreases dramatically as average accuracy increases from ≤ 5% to > 5%.
* The fraction of random tokens increases as average accuracy increases from ≤ 5% to > 5%.
### Interpretation
The chart suggests an inverse relationship between the fraction of critical tokens and the average accuracy. When the average accuracy is low (≤ 5%), critical tokens make up a large portion of the tokens. However, when the average accuracy is higher (> 5%), random tokens become more prevalent. This could indicate that models rely more on critical tokens when they are less accurate, and rely more on random tokens when they are more accurate. The error bars provide a visual representation of the variability in the data.