\n
## Bar Chart: Token Type vs. Average Accuracy Fraction
### Overview
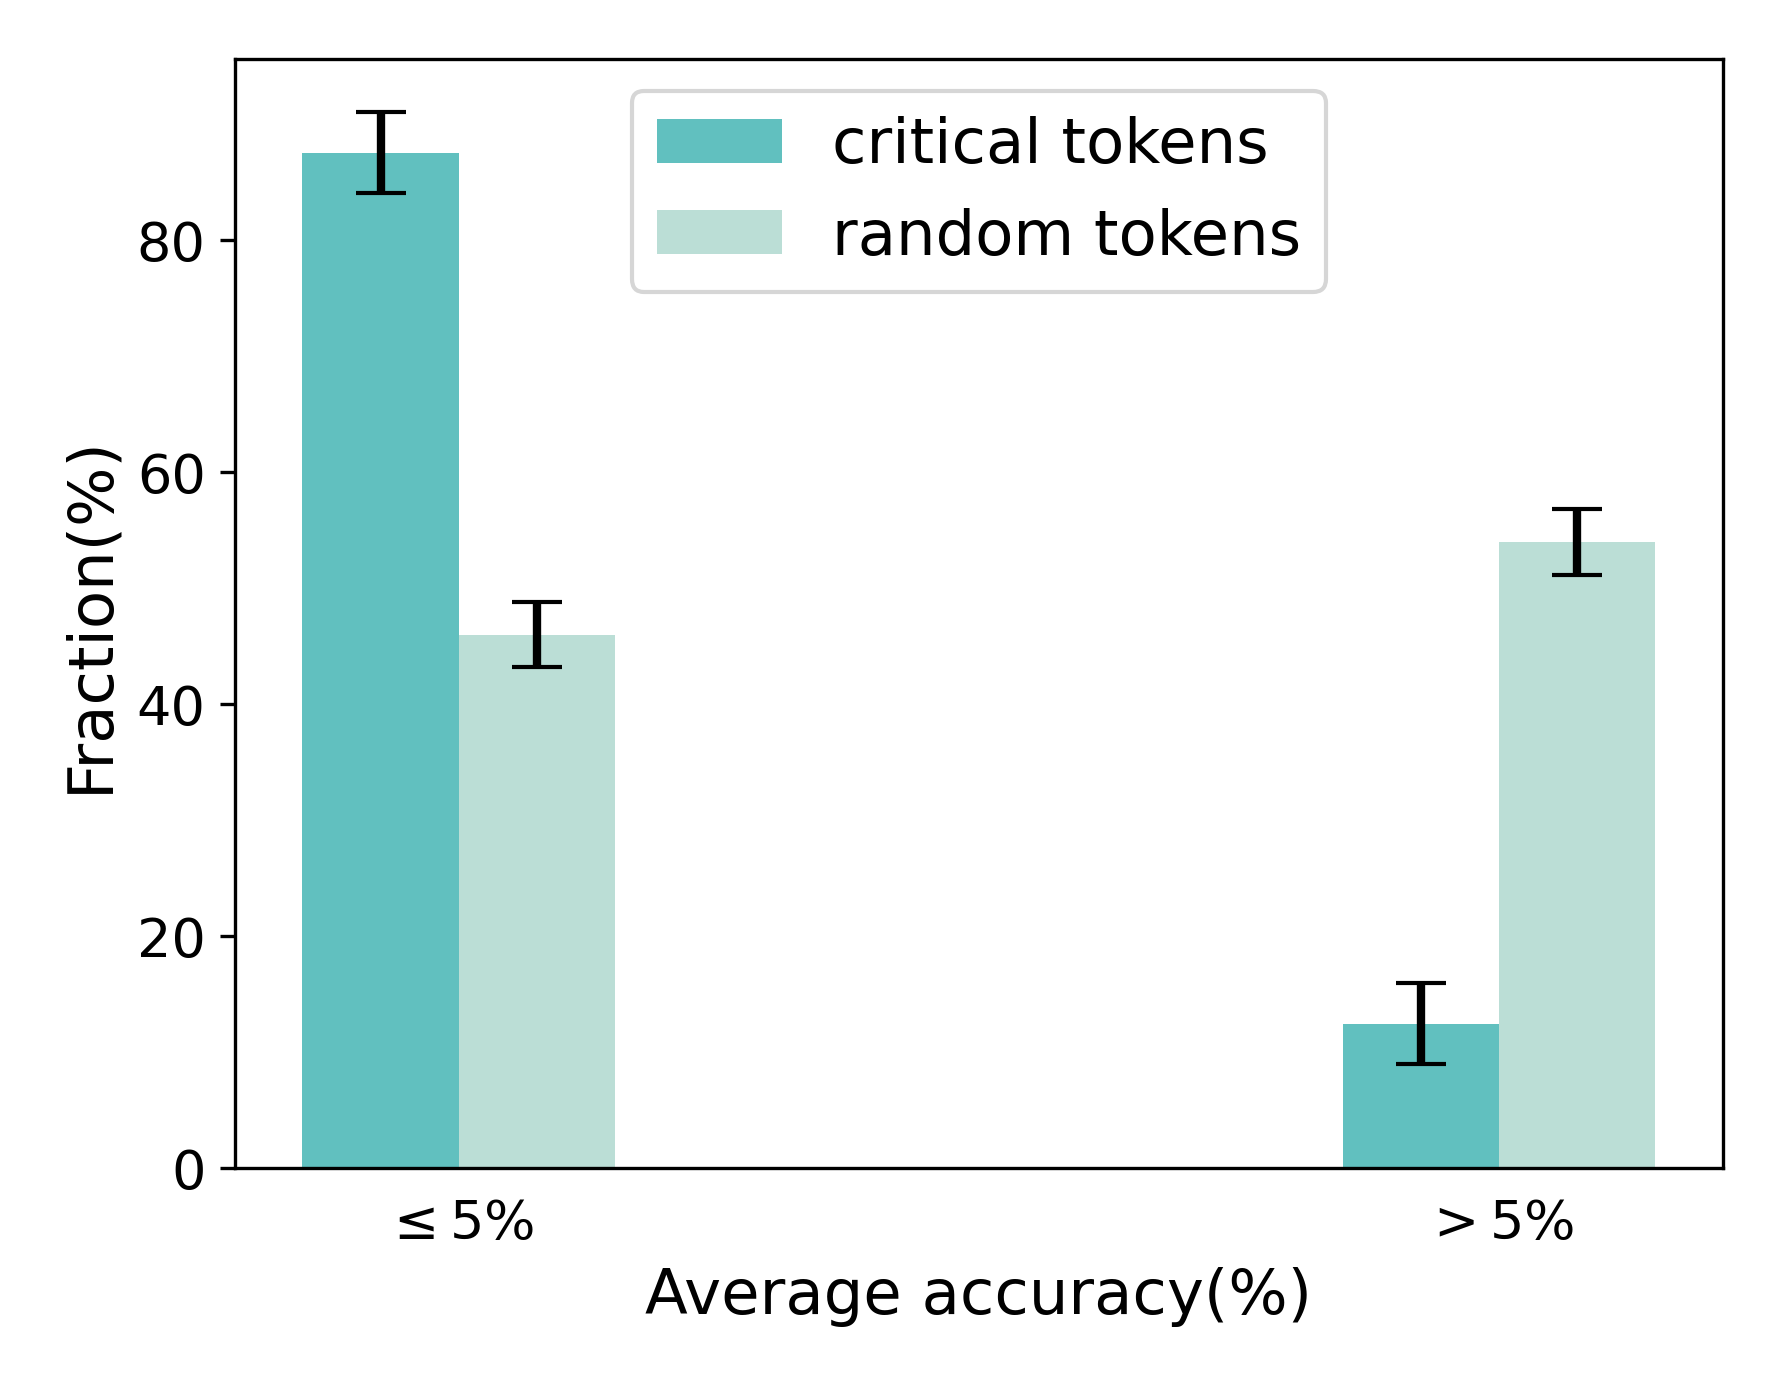
This is a grouped bar chart with error bars, comparing the fraction (percentage) of two token types—"critical tokens" and "random tokens"—across two categories of average accuracy. The chart visually demonstrates a strong inverse relationship between token type and accuracy category.
### Components/Axes
* **Chart Type:** Grouped bar chart with error bars.
* **X-Axis:** Labeled **"Average accuracy(%)"**. It contains two categorical groups:
1. **"≤ 5%"** (Less than or equal to 5 percent)
2. **"> 5%"** (Greater than 5 percent)
* **Y-Axis:** Labeled **"Fraction(%)"**. The scale runs from 0 to 80, with major tick marks at 0, 20, 40, 60, and 80.
* **Legend:** Positioned at the top-center of the chart area. It defines two data series:
* **"critical tokens"** (represented by a teal/darker cyan bar)
* **"random tokens"** (represented by a light teal/pale cyan bar)
* **Error Bars:** Each bar has a black, vertical error bar (I-beam style) indicating variability or confidence intervals around the measured fraction.
### Detailed Analysis
**1. Category: ≤ 5% Average Accuracy**
* **Critical Tokens (Teal Bar):** This is the tallest bar in the chart. Its top aligns approximately with the 85% mark on the y-axis. The error bar extends from roughly 82% to 88%.
* **Random Tokens (Light Teal Bar):** This bar is significantly shorter. Its top is near the 45% mark. The error bar spans approximately from 42% to 48%.
**2. Category: > 5% Average Accuracy**
* **Critical Tokens (Teal Bar):** This is the shortest bar. Its top is near the 12% mark. The error bar ranges from about 9% to 15%.
* **Random Tokens (Light Teal Bar):** This bar is taller than its counterpart in the first category. Its top is near the 55% mark. The error bar extends from approximately 52% to 58%.
### Key Observations
* **Dominant Inversion:** The relationship between token type and accuracy category is inverted. "Critical tokens" have a very high fraction (~85%) in the low-accuracy (≤5%) group but a very low fraction (~12%) in the higher-accuracy (>5%) group.
* **Opposite Trend for Random Tokens:** "Random tokens" show the opposite pattern, with a moderate fraction (~45%) in the low-accuracy group and a higher fraction (~55%) in the higher-accuracy group.
* **Magnitude of Difference:** The disparity between token types is most extreme in the "≤ 5%" category, where critical tokens are nearly double the fraction of random tokens. In the "> 5%" category, random tokens are more than four times the fraction of critical tokens.
* **Error Bar Consistency:** The error bars are relatively small compared to the differences between the bars, suggesting the observed trends are statistically meaningful.
### Interpretation
The data suggests a strong correlation between the type of token present and the resulting model accuracy. **Critical tokens are disproportionately associated with low-accuracy outcomes (≤5%).** Conversely, **random tokens are more frequently associated with higher-accuracy outcomes (>5%).**
This pattern implies that the presence or influence of "critical tokens" may be a key factor in model failure or low-performance scenarios. They could represent problematic, ambiguous, or highly influential tokens that, when present, significantly increase the chance of an incorrect prediction. The higher fraction of random tokens in the >5% accuracy group might indicate that when the model's output is more accurate, it is less reliant on these specific "critical" tokens, or that random tokens are a feature of more stable, correct predictions.
From a diagnostic or improvement perspective, this chart highlights "critical tokens" as a primary target for investigation. Understanding why these tokens correlate so strongly with low accuracy could lead to strategies for improving model robustness, such as targeted data augmentation, specialized preprocessing, or architectural adjustments to better handle these token types.