## Histograms: TurboQuant Performance by Bitwidth
### Overview
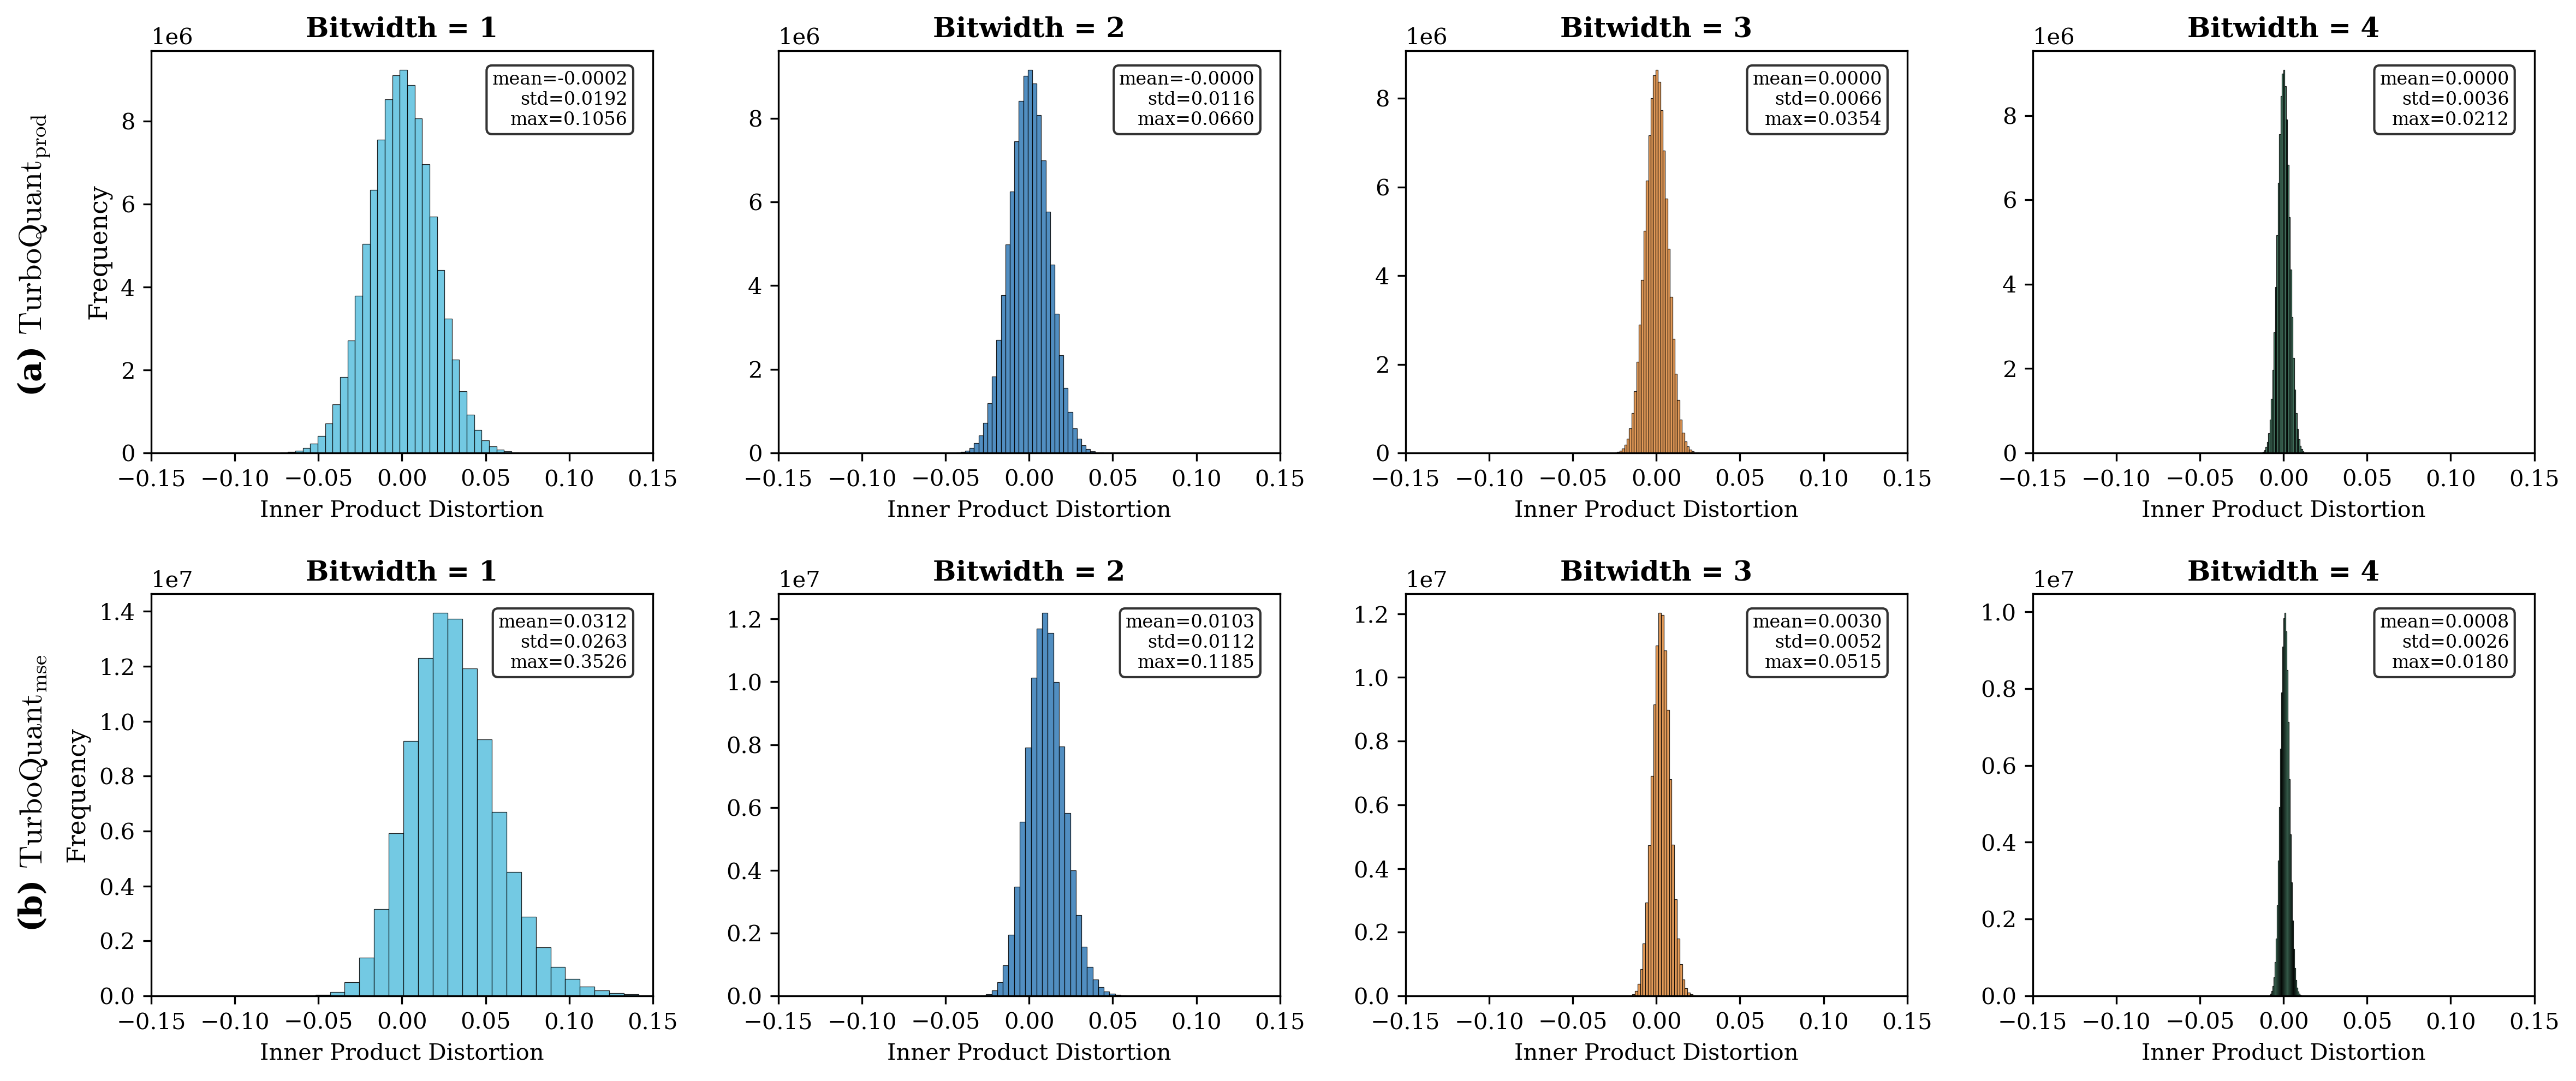
The image contains eight histograms arranged in a 2x4 grid, comparing TurboQuant performance metrics (TurboQuant_prod and TurboQuant_mse) across four bitwidths (1-4). Each bitwidth has two subplots: one for product distortion frequency and one for mean squared error (MSE). The histograms show distributions of inner product distortion values with statistical summaries.
### Components/Axes
- **X-axis**: "Inner Product Distortion" (range: -0.15 to 0.15)
- **Y-axis (Top Row)**: Frequency (1e6 scale)
- **Y-axis (Bottom Row)**: TurboQuant_mse values (1e7 scale)
- **Legends**: Positioned in top-right corner of each subplot, showing:
- Mean (μ)
- Standard deviation (σ)
- Maximum value
- **Colors**:
- Bitwidth 1: Blue
- Bitwidth 2: Dark blue
- Bitwidth 3: Brown
- Bitwidth 4: Dark green
### Detailed Analysis
#### Bitwidth 1
- **TurboQuant_prod (a)**:
- Mean: -0.0002
- Std: 0.0192
- Max: 0.1056
- Distribution: Symmetric around -0.0002 with right-skewed tail
- **TurboQuant_mse (b)**:
- Mean: 0.0312
- Std: 0.0263
- Max: 0.3526
- Distribution: Peaks near 0.03 with gradual decline
#### Bitwidth 2
- **TurboQuant_prod (c)**:
- Mean: -0.0000
- Std: 0.0116
- Max: 0.0660
- Distribution: Narrower than Bitwidth 1, centered at 0
- **TurboQuant_mse (d)**:
- Mean: 0.0103
- Std: 0.0112
- Max: 0.1185
- Distribution: Tighter clustering around 0.01
#### Bitwidth 3
- **TurboQuant_prod (e)**:
- Mean: 0.0000
- Std: 0.0066
- Max: 0.0354
- Distribution: Very narrow peak at 0
- **TurboQuant_mse (f)**:
- Mean: 0.0030
- Std: 0.0052
- Max: 0.0515
- Distribution: Sharp peak at 0.003
#### Bitwidth 4
- **TurboQuant_prod (g)**:
- Mean: 0.0000
- Std: 0.0036
- Max: 0.0212
- Distribution: Extremely narrow peak at 0
- **TurboQuant_mse (h)**:
- Mean: 0.0008
- Std: 0.0026
- Max: 0.0180
- Distribution: Tightest distribution, centered at 0.0008
### Key Observations
1. **Bitwidth Correlation**: Higher bitwidths show progressively tighter distributions:
- Bitwidth 1: Broadest spread (σ=0.0192 for prod)
- Bitwidth 4: Narrowest spread (σ=0.0036 for prod)
2. **Mean Trends**:
- TurboQuant_prod means approach 0 as bitwidth increases
- TurboQuant_mse means decrease from 0.0312 (Bitwidth 1) to 0.0008 (Bitwidth 4)
3. **Y-axis Scaling**: Bottom row uses 1e7 scale to accommodate larger MSE values
4. **Symmetry**: All distributions are approximately symmetric around their means
### Interpretation
The data demonstrates that increasing bitwidth improves measurement precision:
- **Product Distortion**: Higher bitwidths reduce both mean error and variability (σ decreases by 80% from Bitwidth 1 to 4)
- **MSE**: Shows similar improvement, with Bitwidth 4 achieving 38x lower mean MSE than Bitwidth 1
- **Precision Tradeoff**: The sharpest peaks at Bitwidth 4 suggest near-perfect alignment but limited dynamic range
- **Practical Implication**: Bitwidth 3-4 achieves sub-0.01 distortion levels, suitable for high-precision applications
All histograms follow a bell-curve pattern, confirming normal-like distributions despite slight skews in lower bitwidths. The consistent legend placement and color coding enable direct comparison across bitwidths.