# Technical Document Extraction: Probability Distribution Analysis
## 1. Component Isolation
* **Header/Legend:** Located in the top-left quadrant of the plot area.
* **Main Chart:** A histogram plot with overlapping distributions and vertical indicator lines.
* **X-Axis:** Horizontal axis at the bottom representing numerical change values.
* **Y-Axis:** Vertical axis on the left representing probability density.
---
## 2. Metadata and Axis Labels
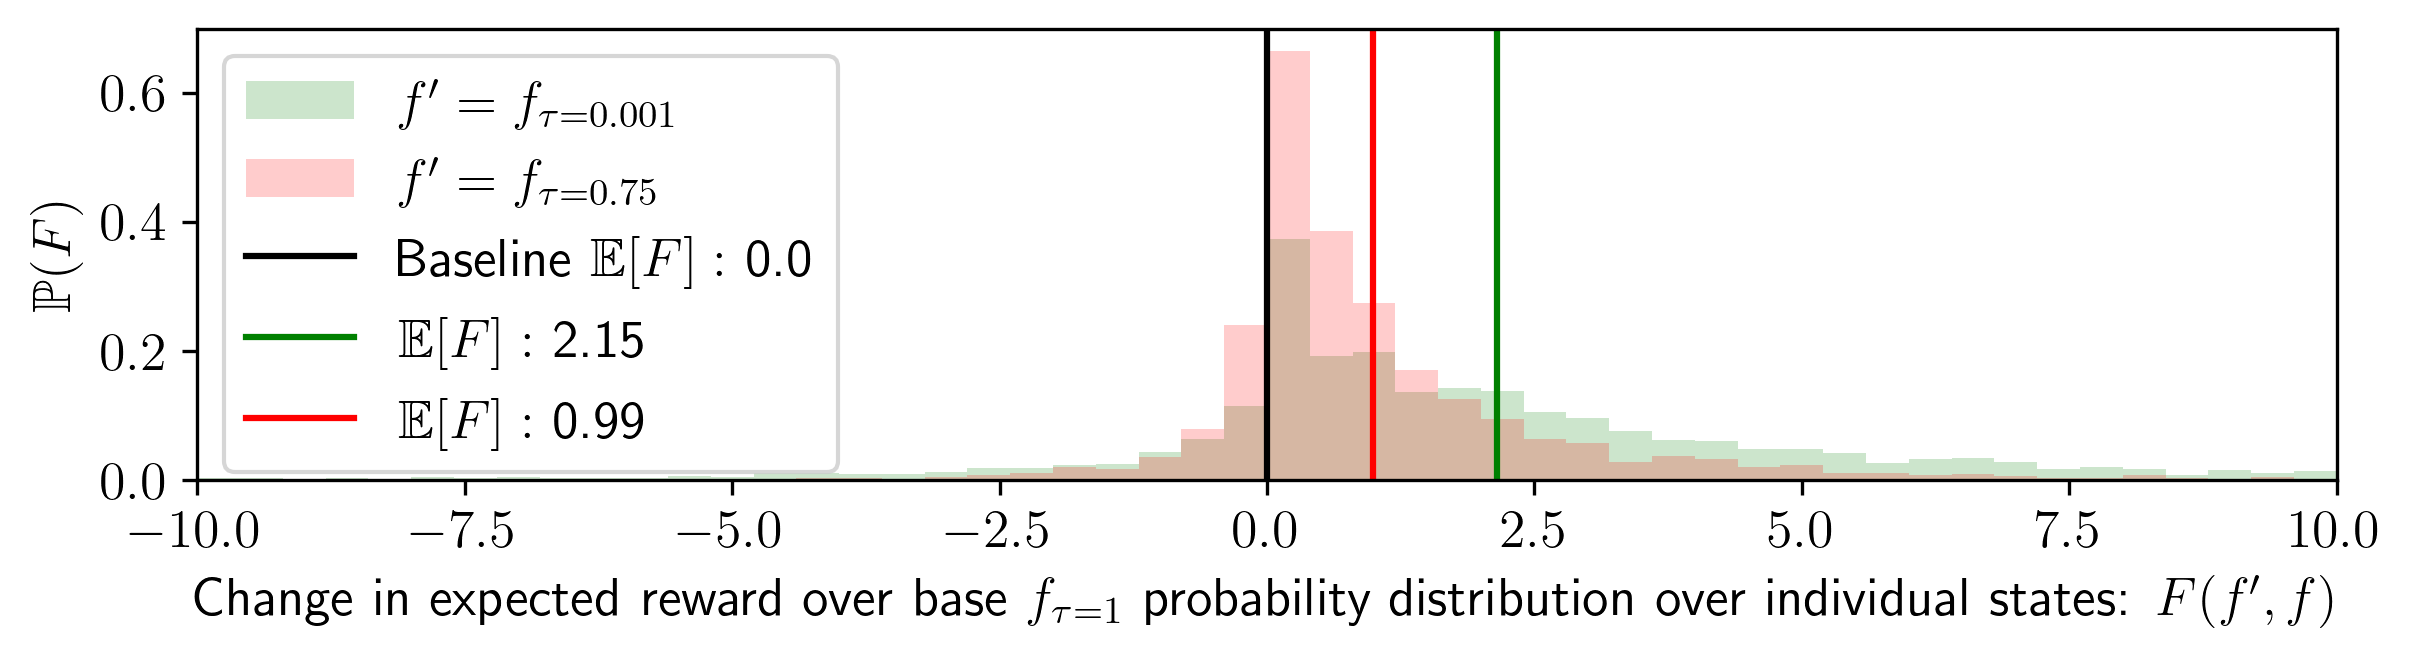
* **Y-Axis Title:** $\mathbb{P}(F')$
* **Y-Axis Markers:** $[0.0, 0.2, 0.4, 0.6]$
* **X-Axis Title:** Change in expected reward over base $f_{\tau=1}$ probability distribution over individual states: $F(f', f)$
* **X-Axis Markers:** $[-10.0, -7.5, -5.0, -2.5, 0.0, 2.5, 5.0, 7.5, 10.0]$
---
## 3. Legend Extraction [Spatial Grounding: Top-Left]
The legend contains five entries, cross-referenced with the visual elements in the chart:
| Legend Icon | Label | Description |
| :--- | :--- | :--- |
| Light Green Box | $f' = f_{\tau=0.001}$ | Distribution for a very low temperature parameter. |
| Light Red Box | $f' = f_{\tau=0.75}$ | Distribution for a moderate temperature parameter. |
| Black Line | Baseline $\mathbb{E}[F] : 0.0$ | Vertical reference line at $x = 0.0$. |
| Green Line | $\mathbb{E}[F] : 2.15$ | Expected value for the green distribution. |
| Red Line | $\mathbb{E}[F] : 0.99$ | Expected value for the red distribution. |
---
## 4. Data Series Analysis and Trends
### Series 1: $f' = f_{\tau=0.001}$ (Light Green Histogram)
* **Visual Trend:** This distribution is highly "heavy-tailed" to the right. While it has a peak near zero, it maintains a significant, low-level density stretching far into the positive x-range (up to 10.0 and likely beyond).
* **Central Tendency:** Indicated by the **Green Vertical Line** at $x = 2.15$.
* **Observation:** The spread is much wider than the red distribution, indicating higher variance in the change of expected reward.
### Series 2: $f' = f_{\tau=0.75}$ (Light Red Histogram)
* **Visual Trend:** This distribution is much more concentrated (peaked) around the zero point. It drops off significantly faster than the green distribution as $x$ increases.
* **Peak Height:** The highest bin is located just to the right of $0.0$, reaching a probability density of approximately $0.65$.
* **Central Tendency:** Indicated by the **Red Vertical Line** at $x = 0.99$.
* **Observation:** This represents a more conservative shift compared to the $\tau=0.001$ setting.
### Overlap (Tan/Brown Areas)
* Where the red and green histograms overlap, the color appears as a muted tan. The highest concentration of overlap is between $x = 0.0$ and $x = 2.5$.
---
## 5. Key Data Points and Indicators
* **Baseline:** A solid black vertical line is fixed at **0.0**, representing the reference point for "no change."
* **Red Mean ($\mathbb{E}[F]$):** Located at **0.99**. It sits within the primary mass of the red histogram.
* **Green Mean ($\mathbb{E}[F]$):** Located at **2.15**. Despite the green histogram having a lower peak than the red one near zero, its long right tail pulls the expected value significantly further to the right.
* **Range:** The data shown spans from approximately $-7.5$ to $10.0$, though the bulk of the probability mass for both distributions is located in the $[0.0, 5.0]$ range.