# Technical Document Extraction: Probability Distribution Chart
## Chart Overview
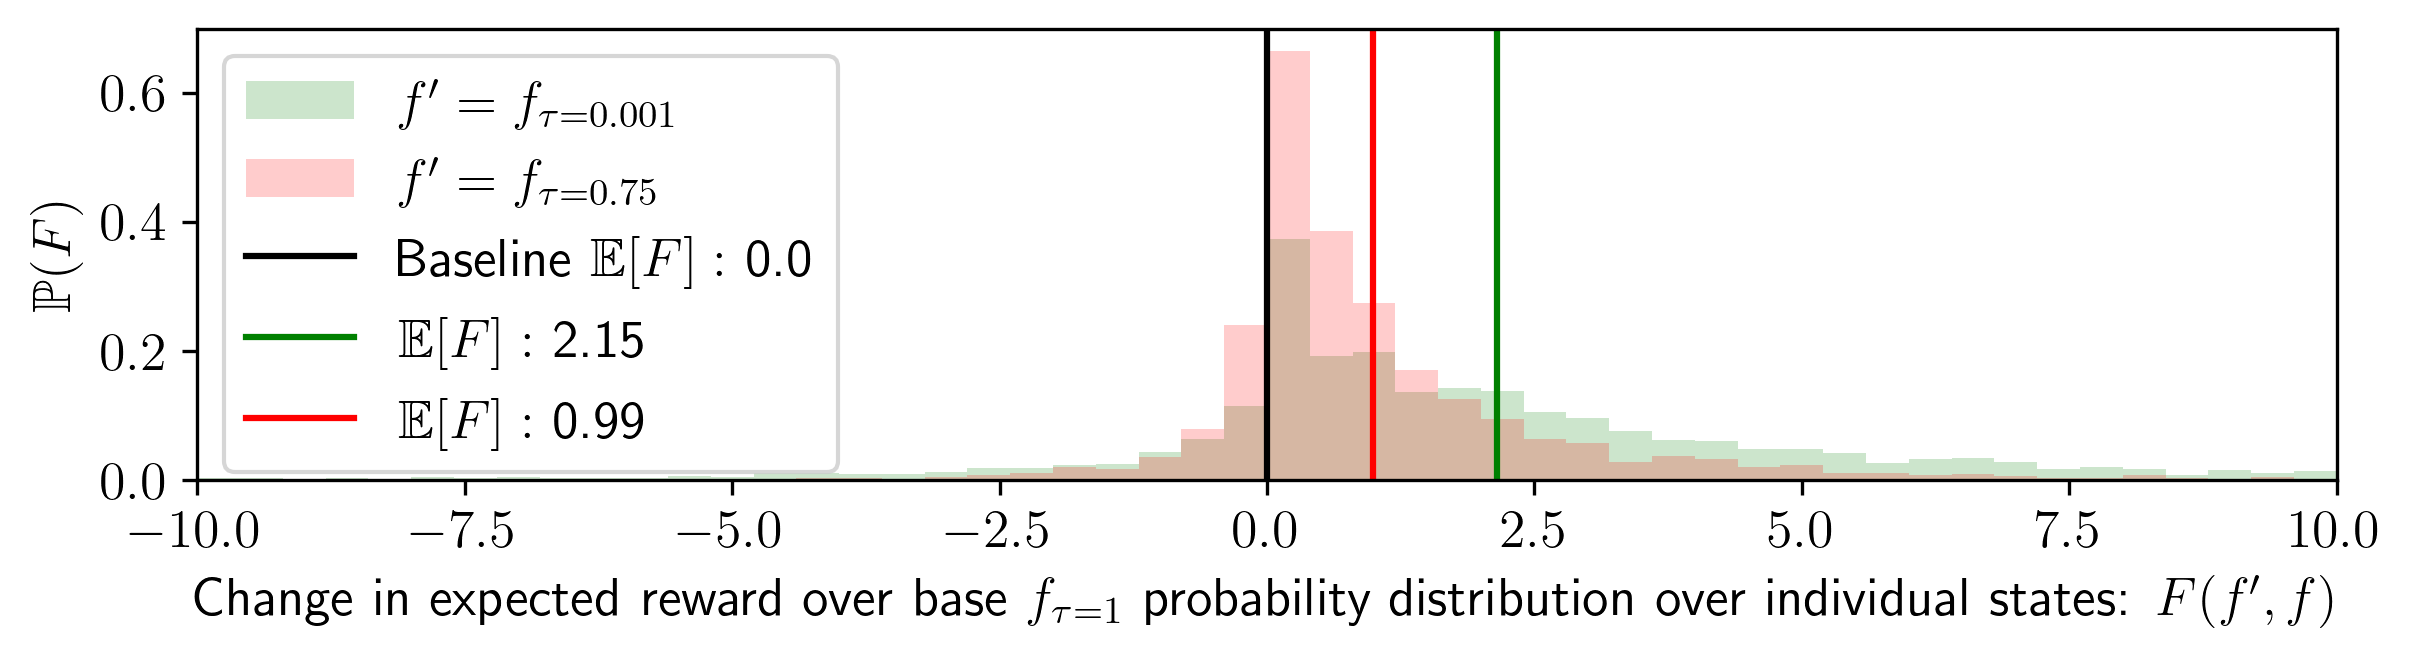
The image depicts a probability distribution chart analyzing changes in expected reward over a base probability distribution. Key components include axes, legends, shaded regions, and vertical reference lines.
---
### **Axes and Labels**
- **X-Axis**:
- Title: *"Change in expected reward over base fτ=1 probability distribution over individual states: F(f′,f)"*
- Range: -10.0 to 10.0
- Markers: -10.0, -7.5, -5.0, -2.5, 0.0, 2.5, 5.0, 7.5, 10.0
- **Y-Axis**:
- Title: *"P(F)"* (Probability of F)
- Range: 0.0 to 0.6
- Markers: 0.0, 0.2, 0.4, 0.6
---
### **Legend**
- **Location**: Upper-left corner of the chart.
- **Entries**:
1. **Baseline**: Black vertical line at `E[F] = 0.0`.
2. **f′ = fτ=0.001**: Green shaded histogram.
3. **f′ = fτ=0.75**: Pink shaded histogram.
4. **E[F] = 2.15**: Green vertical line at x = 2.15.
5. **E[F] = 0.99**: Red vertical line at x = 0.99.
---
### **Chart Components**
1. **Baseline (Black Line)**:
- Vertical line at `x = 0.0`, representing the baseline expected reward (`E[F] = 0.0`).
2. **Probability Distributions**:
- **f′ = fτ=0.001 (Green)**:
- Shaded histogram peaking near `x ≈ -2.5`.
- Extends from `x ≈ -7.5` to `x ≈ 2.5`.
- **f′ = fτ=0.75 (Pink)**:
- Shaded histogram peaking near `x ≈ 0.5`.
- Extends from `x ≈ -2.5` to `x ≈ 5.0`.
3. **Expected Value Markers**:
- **E[F] = 2.15 (Green Line)**: Vertical line at `x = 2.15`.
- **E[F] = 0.99 (Red Line)**: Vertical line at `x = 0.99`.
---
### **Trends and Observations**
- **Baseline**: The black line at `x = 0.0` serves as the reference point for comparing deviations in expected reward.
- **f′ = fτ=0.001 (Green)**:
- Distribution is skewed left, with higher probability density in negative reward changes.
- Peaks at `x ≈ -2.5`, indicating a higher likelihood of reduced rewards compared to the baseline.
- **f′ = fτ=0.75 (Pink)**:
- Distribution is centered closer to the baseline but slightly right-skewed.
- Peaks at `x ≈ 0.5`, suggesting moderate positive reward changes on average.
- **Expected Values**:
- `E[F] = 0.99` (red) and `E[F] = 2.15` (green) represent mean reward changes for the respective distributions.
---
### **Spatial Grounding**
- **Legend Position**: Upper-left corner (coordinates: `[x ≈ 0.05, y ≈ 0.95]` relative to chart boundaries).
- **Color Consistency**:
- Green legend entry matches the green shaded histogram and green vertical line (`E[F] = 2.15`).
- Pink legend entry matches the pink shaded histogram.
- Black legend entry matches the baseline vertical line.
---
### **Conclusion**
The chart compares two modified probability distributions (`f′ = fτ=0.001` and `f′ = fτ=0.75`) against a baseline (`fτ=1`). The green distribution (`fτ=0.001`) shows a higher probability of negative reward changes, while the pink distribution (`fτ=0.75`) leans toward positive changes. Expected values (`E[F]`) are marked at 0.99 and 2.15, providing quantitative benchmarks for comparison.