## Line Charts: Splash Attention vs. Naive Attention Performance
### Overview
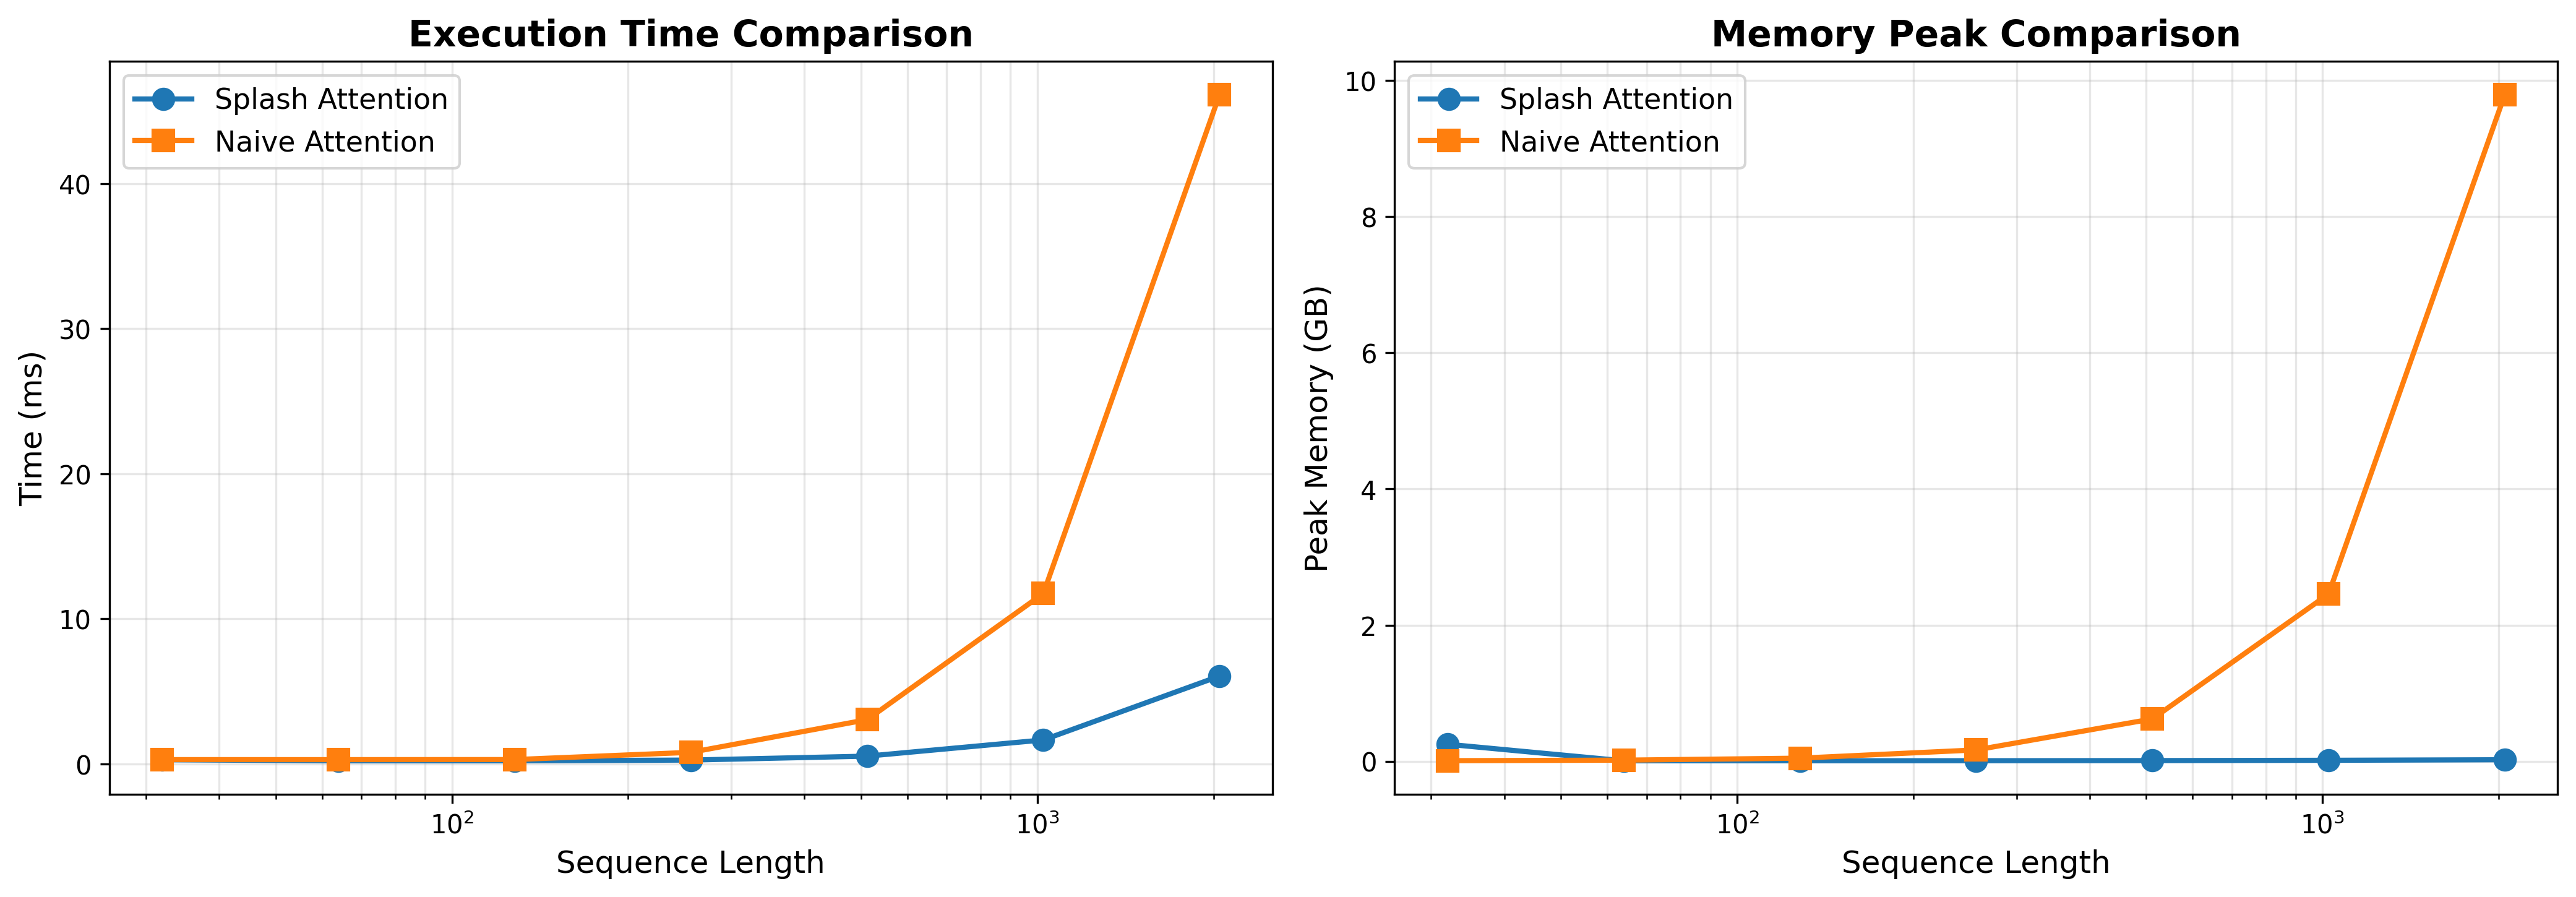
The image consists of two side-by-side line charts comparing the performance of two computational methods: "Splash Attention" and "Naive Attention." The left chart compares Execution Time, while the right chart compares Peak Memory usage. Both charts measure these metrics against an increasing "Sequence Length." The language used in the image is entirely English.
### Component Isolation & Spatial Grounding
The image is divided into two distinct halves:
1. **Left Chart:** Focuses on Execution Time.
2. **Right Chart:** Focuses on Peak Memory.
**Shared Elements:**
* **X-Axis (Both Charts):** Labeled "Sequence Length" at the bottom center of each chart. The scale is logarithmic (base 10), with major gridline markers explicitly labeled at $10^2$ (100) and $10^3$ (1000). Based on the spacing and standard machine learning practices, the data points are plotted at powers of 2 (approximately 32, 64, 128, 256, 512, 1024, 2048).
* **Legend (Both Charts):** Positioned in the top-left corner of the plotting area, enclosed in a white box with a light gray border.
* Blue line with solid circular markers: "Splash Attention"
* Orange line with solid square markers: "Naive Attention"
* **Grid:** Both charts feature a light gray, semi-transparent grid. Vertical lines follow the logarithmic scale, while horizontal lines follow the linear Y-axis scale.
---
### Detailed Analysis: Left Chart (Execution Time Comparison)
* **Header:** "Execution Time Comparison" (Centered at the top of the left chart).
* **Y-Axis:** Labeled "Time (ms)" vertically on the left side. The scale is linear, with major markers at 0, 10, 20, 30, and 40.
**Trend Verification & Data Extraction:**
* **Splash Attention (Blue Line / Circular Markers):**
* *Trend:* The line remains nearly flat and close to zero for the majority of the sequence lengths. It only begins a very slight upward slope at the final two data points.
* *Approximate Data Points:*
* Seq Len ~32: ~0.2 ms
* Seq Len ~64: ~0.2 ms
* Seq Len ~128: ~0.2 ms
* Seq Len ~256: ~0.3 ms
* Seq Len ~512: ~0.5 ms
* Seq Len ~1024 ($10^3$): ~1.5 ms
* Seq Len ~2048: ~6.0 ms
* **Naive Attention (Orange Line / Square Markers):**
* *Trend:* The line starts flat, identical to Splash Attention. However, after a sequence length of ~256, it begins to curve upward. After ~512, it exhibits a steep, exponential/quadratic upward trajectory.
* *Approximate Data Points:*
* Seq Len ~32: ~0.2 ms
* Seq Len ~64: ~0.2 ms
* Seq Len ~128: ~0.3 ms
* Seq Len ~256: ~0.8 ms
* Seq Len ~512: ~3.0 ms
* Seq Len ~1024 ($10^3$): ~11.8 ms
* Seq Len ~2048: ~46.0 ms
---
### Detailed Analysis: Right Chart (Memory Peak Comparison)
* **Header:** "Memory Peak Comparison" (Centered at the top of the right chart).
* **Y-Axis:** Labeled "Peak Memory (GB)" vertically on the left side. The scale is linear, with major markers at 0, 2, 4, 6, 8, and 10.
**Trend Verification & Data Extraction:**
* **Splash Attention (Blue Line / Circular Markers):**
* *Trend:* There is a slight anomaly at the very first data point where memory is slightly elevated. Immediately after, the line drops to near-zero and remains perfectly flat horizontally across all subsequent sequence lengths.
* *Approximate Data Points:*
* Seq Len ~32: ~0.25 GB
* Seq Len ~64: ~0.01 GB
* Seq Len ~128: ~0.01 GB
* Seq Len ~256: ~0.01 GB
* Seq Len ~512: ~0.01 GB
* Seq Len ~1024 ($10^3$): ~0.01 GB
* Seq Len ~2048: ~0.01 GB
* **Naive Attention (Orange Line / Square Markers):**
* *Trend:* The line starts near zero. Similar to the execution time chart, it begins a noticeable upward curve around a sequence length of ~256 and scales up dramatically (quadratically) as sequence length increases.
* *Approximate Data Points:*
* Seq Len ~32: ~0.01 GB
* Seq Len ~64: ~0.01 GB
* Seq Len ~128: ~0.05 GB
* Seq Len ~256: ~0.15 GB
* Seq Len ~512: ~0.6 GB
* Seq Len ~1024 ($10^3$): ~2.5 GB
* Seq Len ~2048: ~9.8 GB
---
### Key Observations
1. **Divergence Point:** In both execution time and memory, the performance of the two methods is nearly indistinguishable at shorter sequence lengths (under 256). The critical divergence point occurs between sequence lengths of 256 and 512.
2. **Memory Flatline:** The most striking visual feature is the Splash Attention memory curve (Right Chart, Blue Line). After the initial point, it demonstrates constant $O(1)$ memory usage relative to sequence length, whereas Naive Attention consumes nearly 10 GB at the maximum plotted length.
3. **Time Scaling:** While Splash Attention's execution time does increase at the highest sequence length (reaching ~6ms), it is roughly 7.5 times faster than Naive Attention (~46ms) at a sequence length of ~2048.
4. **Initial Memory Anomaly:** Splash Attention shows a slightly higher peak memory at the lowest sequence length (~32) compared to Naive Attention, before dropping to near zero.
### Interpretation
These charts demonstrate a classic problem in machine learning, specifically regarding Transformer architectures. "Naive Attention" represents the standard self-attention mechanism, which is mathematically known to have $O(N^2)$ (quadratic) complexity for both time and memory with respect to sequence length ($N$). The orange lines perfectly illustrate this quadratic explosion; as the sequence length doubles from 1024 to 2048, the time and memory roughly quadruple.
"Splash Attention" represents an optimized, likely sparse or linear, attention mechanism designed to solve this bottleneck.
* **Reading between the lines:** The data suggests Splash Attention achieves linear $O(N)$ time complexity (the blue line on the left grows much slower than the quadratic orange line) and potentially constant $O(1)$ or highly optimized memory complexity for the attention calculation itself (the flat blue line on the right).
* **Practical Application:** This data proves that Splash Attention is highly scalable. While Naive Attention would quickly run out of VRAM (GPU memory) on longer documents, Splash Attention could theoretically handle vastly longer contexts (e.g., entire books or long codebases) without crashing due to memory limits, while also computing the results significantly faster. The slight memory overhead at the very beginning for Splash Attention likely indicates a fixed initialization cost or buffer allocation that becomes negligible as the sequence grows.