## Chart: Execution Time and Memory Peak Comparison
### Overview
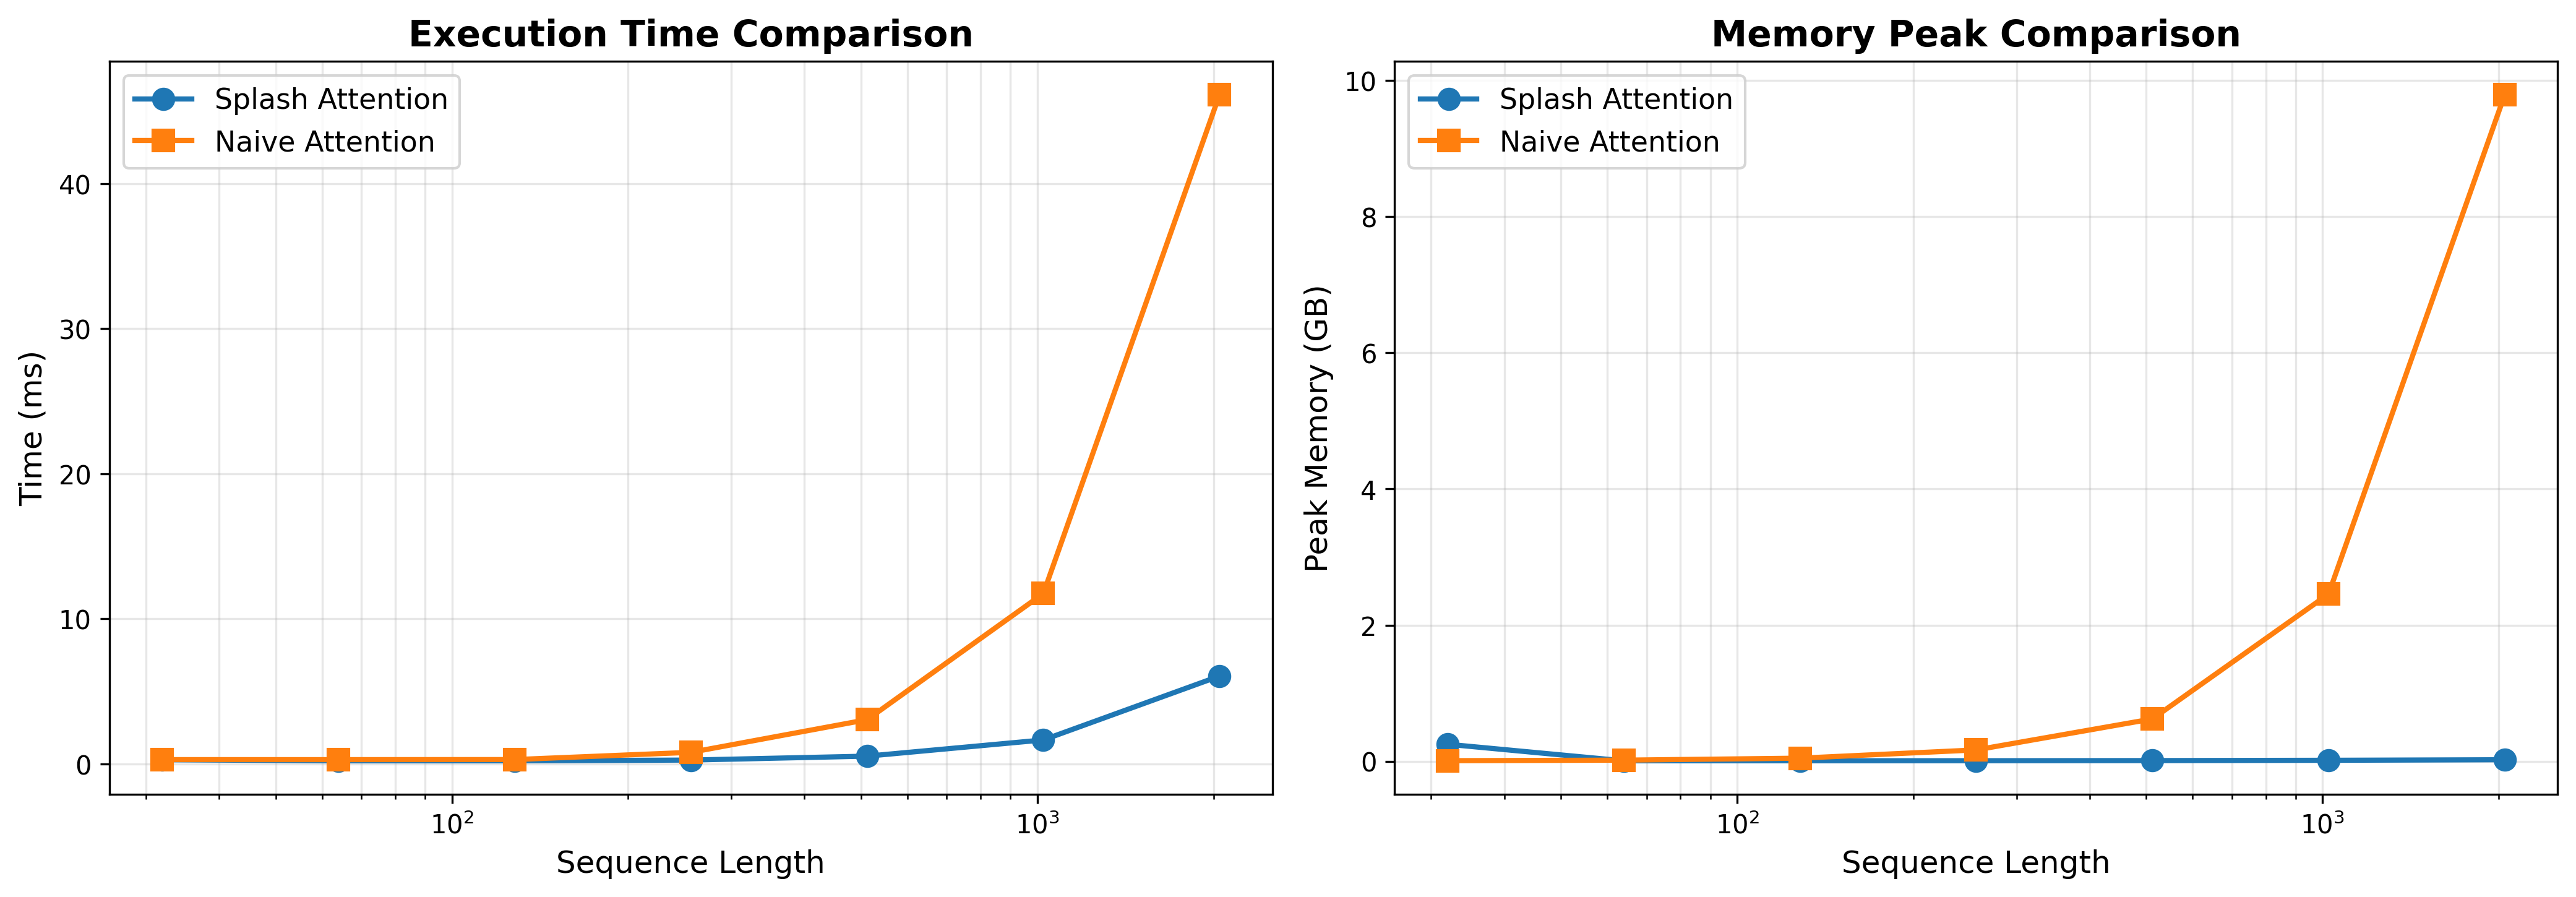
The image presents two line charts comparing the performance of "Splash Attention" and "Naive Attention" mechanisms. The left chart compares execution time (in milliseconds) against sequence length (logarithmic scale), while the right chart compares peak memory usage (in GB) against sequence length (logarithmic scale).
### Components/Axes
**Left Chart: Execution Time Comparison**
* **Title:** Execution Time Comparison
* **Y-axis:** Time (ms), linear scale from 0 to 40, with tick marks at 0, 10, 20, 30, and 40.
* **X-axis:** Sequence Length, logarithmic scale from approximately 10^1 to 10^3. Tick marks are present at 10^1, 10^2, and 10^3.
* **Legend (Top-Left):**
* Blue line with circle markers: Splash Attention
* Orange line with square markers: Naive Attention
**Right Chart: Memory Peak Comparison**
* **Title:** Memory Peak Comparison
* **Y-axis:** Peak Memory (GB), linear scale from 0 to 10, with tick marks at 0, 2, 4, 6, 8, and 10.
* **X-axis:** Sequence Length, logarithmic scale from approximately 10^1 to 10^3. Tick marks are present at 10^1, 10^2, and 10^3.
* **Legend (Top-Left):**
* Blue line with circle markers: Splash Attention
* Orange line with square markers: Naive Attention
### Detailed Analysis
**Left Chart: Execution Time Comparison**
* **Splash Attention (Blue):** The execution time remains relatively flat and low as sequence length increases.
* Sequence Length ~10^1: Time ~0 ms
* Sequence Length ~10^2: Time ~1 ms
* Sequence Length ~10^3: Time ~6 ms
* **Naive Attention (Orange):** The execution time increases significantly with sequence length.
* Sequence Length ~10^1: Time ~0 ms
* Sequence Length ~10^2: Time ~1 ms
* Sequence Length ~3*10^2: Time ~3 ms
* Sequence Length ~10^3: Time ~12 ms
* Sequence Length ~2*10^3: Time ~48 ms
**Right Chart: Memory Peak Comparison**
* **Splash Attention (Blue):** The peak memory usage remains very low and almost constant as sequence length increases.
* Sequence Length ~10^1: Memory ~0.3 GB
* Sequence Length ~10^2: Memory ~0 GB
* Sequence Length ~10^3: Memory ~0.1 GB
* **Naive Attention (Orange):** The peak memory usage increases significantly with sequence length.
* Sequence Length ~10^1: Memory ~0 GB
* Sequence Length ~10^2: Memory ~0.5 GB
* Sequence Length ~10^3: Memory ~2.5 GB
* Sequence Length ~2*10^3: Memory ~9.8 GB
### Key Observations
* Splash Attention consistently outperforms Naive Attention in both execution time and memory usage, especially as sequence length increases.
* Naive Attention's performance degrades significantly with increasing sequence length, showing exponential growth in both time and memory.
* Splash Attention maintains a relatively stable and low resource footprint regardless of sequence length.
### Interpretation
The data strongly suggests that Splash Attention is a more efficient attention mechanism compared to Naive Attention, particularly for longer sequences. The exponential increase in execution time and memory usage for Naive Attention makes it less scalable and potentially impractical for large sequence lengths. Splash Attention's consistent performance indicates a more optimized and resource-friendly approach. The charts highlight the importance of choosing the right attention mechanism based on the expected sequence lengths and resource constraints.