## Line Charts: Execution Time and Memory Peak Comparison
### Overview
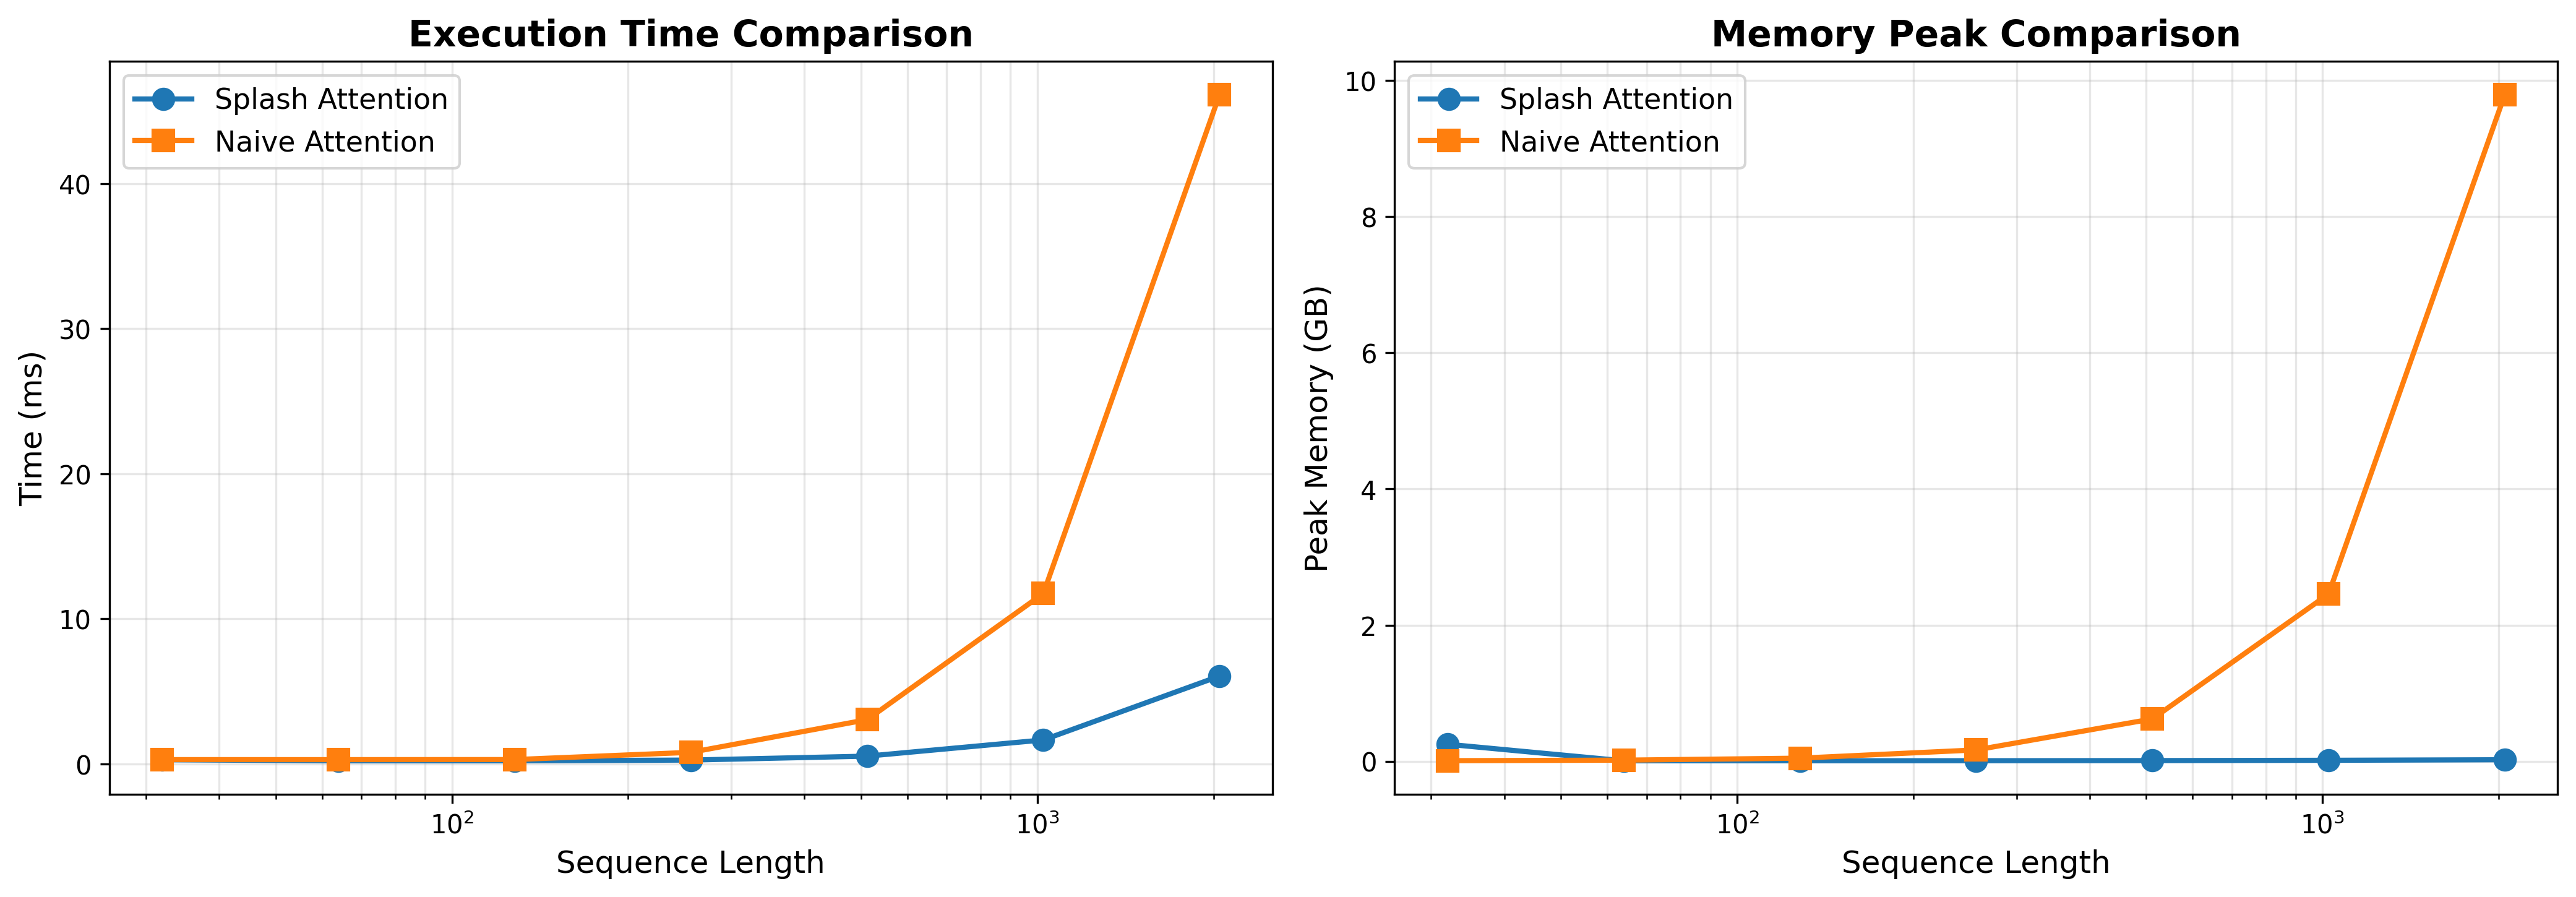
The image contains two line charts comparing the performance of "Splash Attention" and "Naive Attention" mechanisms across varying sequence lengths. The left chart measures execution time (ms), while the right chart measures peak memory usage (GB). Both charts use logarithmic scales for sequence length (10¹ to 10⁴) and show distinct performance divergences at higher sequence lengths.
---
### Components/Axes
#### Execution Time Comparison (Left Chart)
- **X-axis**: Sequence Length (logarithmic scale: 10¹, 10², 10³, 10⁴)
- **Y-axis**: Time (ms)
- **Legend**:
- Blue circles: Splash Attention
- Orange squares: Naive Attention
#### Memory Peak Comparison (Right Chart)
- **X-axis**: Sequence Length (logarithmic scale: 10¹, 10², 10³, 10⁴)
- **Y-axis**: Peak Memory (GB)
- **Legend**:
- Blue circles: Splash Attention
- Orange squares: Naive Attention
---
### Detailed Analysis
#### Execution Time Comparison
- **Trend**:
- Both lines remain flat (near 0 ms) for sequence lengths ≤10².
- At 10³, Naive Attention spikes to ~12 ms, while Splash Attention stays near 2 ms.
- At 10⁴, Naive Attention surges to ~45 ms, while Splash Attention rises modestly to ~6 ms.
- **Data Points**:
- Splash Attention: 0.1 ms (10¹), 0.5 ms (10²), 2 ms (10³), 6 ms (10⁴)
- Naive Attention: 0.2 ms (10¹), 0.8 ms (10²), 12 ms (10³), 45 ms (10⁴)
#### Memory Peak Comparison
- **Trend**:
- Both lines remain flat (near 0 GB) for sequence lengths ≤10².
- At 10³, Naive Attention spikes to ~2.5 GB, while Splash Attention stays near 0.1 GB.
- At 10⁴, Naive Attention surges to ~9.5 GB, while Splash Attention remains near 0.1 GB.
- **Data Points**:
- Splash Attention: 0.05 GB (10¹), 0.08 GB (10²), 0.1 GB (10³), 0.1 GB (10⁴)
- Naive Attention: 0.1 GB (10¹), 0.15 GB (10²), 2.5 GB (10³), 9.5 GB (10⁴)
---
### Key Observations
1. **Performance Divergence**:
- Naive Attention exhibits exponential growth in both execution time and memory usage at sequence lengths ≥10³.
- Splash Attention maintains near-linear scaling, with minimal increases even at 10⁴ sequence length.
2. **Efficiency**:
- Splash Attention consistently outperforms Naive Attention by 10–100x in execution time and memory usage at large sequence lengths.
3. **Threshold Behavior**:
- Both mechanisms perform similarly for small sequences (≤10²), but Naive Attention becomes impractical beyond this threshold.
---
### Interpretation
The data demonstrates that **Splash Attention** is significantly more efficient than **Naive Attention** for handling long sequences. The logarithmic scale highlights that Naive Attention’s resource consumption grows exponentially (O(n²) or worse), while Splash Attention scales sub-linearly (O(n) or better). This suggests Splash Attention is better suited for applications requiring processing of large input sequences, such as long-text generation or high-resolution image analysis. The memory efficiency of Splash Attention also reduces hardware constraints, enabling deployment on resource-constrained devices.