## Line Chart: Cross-Model α Profiles
### Overview
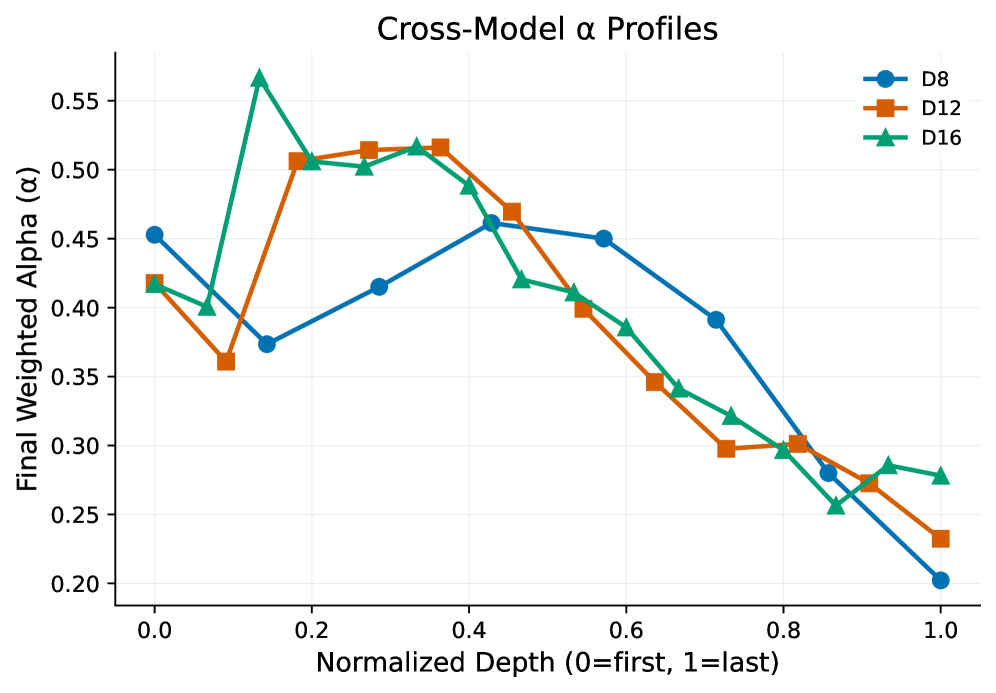
The chart compares the **Final Weighted Alpha (α)** performance of three models (D8, D12, D16) across **Normalized Depth** (0 = first layer, 1 = last layer). The y-axis ranges from 0.20 to 0.55, while the x-axis spans 0.0 to 1.0. Three distinct lines represent the models, with markers and colors matching the legend.
### Components/Axes
- **X-Axis**: Normalized Depth (0.0 to 1.0, labeled "Normalized Depth (0=first, 1=last)").
- **Y-Axis**: Final Weighted Alpha (α) (0.20 to 0.55, labeled "Final Weighted Alpha (α)").
- **Legend**: Located in the top-right corner, associating:
- **D8**: Blue circles (●).
- **D12**: Orange squares (■).
- **D16**: Green triangles (▲).
### Detailed Analysis
1. **D8 (Blue Circles)**:
- Starts at ~0.45 at depth 0.0.
- Dips to ~0.37 at depth 0.2.
- Peaks at ~0.46 at depth 0.4.
- Declines steadily to ~0.20 at depth 1.0.
2. **D12 (Orange Squares)**:
- Begins at ~0.42 at depth 0.0.
- Rises sharply to ~0.51 at depth 0.3.
- Declines to ~0.23 at depth 1.0, with a notable drop after depth 0.6.
3. **D16 (Green Triangles)**:
- Starts at ~0.42 at depth 0.0.
- Spikes to ~0.57 at depth 0.15 (highest value in the chart).
- Declines to ~0.28 at depth 1.0, with a steep drop after depth 0.3.
### Key Observations
- **D16** exhibits the most extreme variability, with a sharp early peak (~0.57) followed by a rapid decline.
- **D8** shows the most stable trend, maintaining values above 0.35 until depth 0.8 before a steep drop.
- **D12** has a bimodal pattern: a rise to ~0.51 at depth 0.3, then a consistent decline.
- All models converge near ~0.25–0.30 at depth 0.8–1.0, suggesting similar performance at deeper layers.
### Interpretation
The data suggests that **D16** is highly sensitive to shallow layers (depth 0.0–0.3), achieving the highest α but collapsing sharply at deeper layers. **D8** demonstrates robustness across mid-depths (0.0–0.6) but falters at the deepest layers. **D12** shows moderate performance with a peak at intermediate depth (0.3), possibly indicating optimal tuning for that range. The convergence at deeper layers implies that all models may struggle with lower-weighted contributions in later stages. This could reflect architectural differences in how each model prioritizes early vs. late-layer features.