## Heatmap Visualization: RWKV Model Matrix Analysis
### Overview
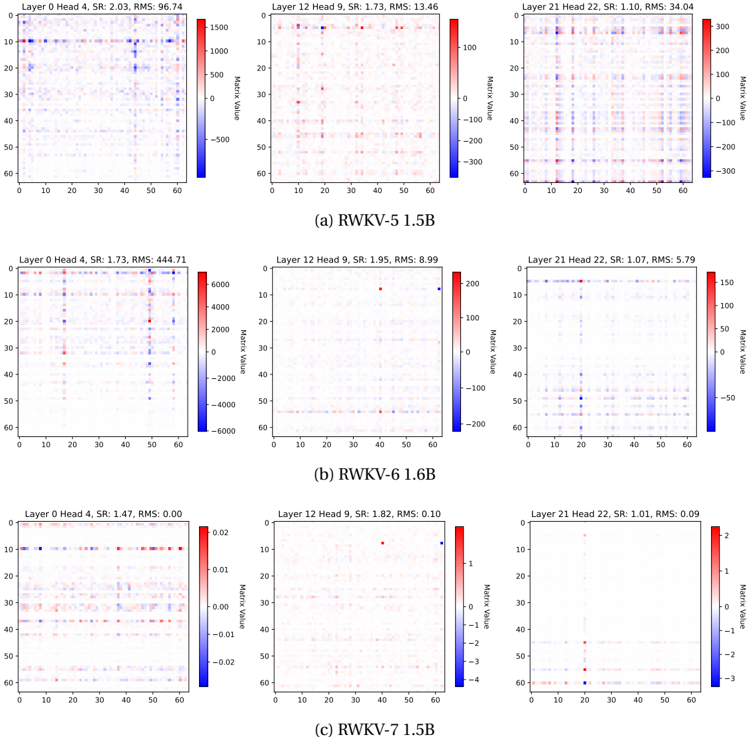
The image presents three comparative heatmap visualizations of matrix values across different RWKV model architectures (5B, 6B, 7B). Each section contains three heatmaps showing matrix values for specific layer-head combinations, with color intensity representing value magnitude and RMS (Root Mean Square) metrics indicating value distribution characteristics.
### Components/Axes
**Common Elements Across All Heatmaps:**
- **X-axis**: Layer indices (0, 12, 21)
- **Y-axis**: Head indices (4, 9, 22)
- **Color Scale**: Matrix value magnitude (blue = negative, red = positive)
- **Legend**: Positioned right-aligned with color gradient from blue (-) to red (+)
- **Title Format**: "Layer [X] Head [Y], SR: [Z], RMS: [W]"
**Section-Specific Details:**
1. **(a) RWKV-5 1.5B**
- Color Scale: -1500 to +1500
- RMS Values: 96.74 (Layer 0), 13.46 (Layer 12), 34.04 (Layer 21)
- SR Values: 2.03 (Layer 0), 1.73 (Layer 12), 1.10 (Layer 21)
2. **(b) RWKV-6 1.6B**
- Color Scale: -6000 to +6000
- RMS Values: 444.71 (Layer 0), 1.95 (Layer 12), 5.79 (Layer 21)
- SR Values: 1.73 (Layer 0), 1.95 (Layer 12), 1.07 (Layer 21)
3. **(c) RWKV-7 1.5B**
- Color Scale: -0.02 to +0.02
- RMS Values: 0.00 (Layer 0), 0.10 (Layer 12), 0.09 (Layer 21)
- SR Values: 1.47 (Layer 0), 1.82 (Layer 12), 1.01 (Layer 21)
### Detailed Analysis
**Section (a) RWKV-5 1.5B:**
- Layer 0 shows extreme value distribution with large positive/negative spikes (e.g., Head 4: SR=2.03, RMS=96.74)
- Layer 12 exhibits moderate variation (SR=1.73, RMS=13.46)
- Layer 21 demonstrates reduced variability (SR=1.10, RMS=34.04)
**Section (b) RWKV-6 1.6B:**
- Layer 0 maintains high variability (SR=1.73, RMS=444.71)
- Layer 12 shows significant improvement (SR=1.95, RMS=1.95)
- Layer 21 exhibits moderate stability (SR=1.07, RMS=5.79)
**Section (c) RWKV-7 1.5B:**
- All layers show near-zero RMS values (<0.10)
- Matrix values cluster tightly around zero (color scale compressed to ±0.02)
- SR values indicate consistent scaling across layers (1.47-1.82)
### Key Observations
1. **Model Evolution Trends:**
- RMS values decrease significantly from RWKV-5 to RWKV-7 (96.74 → 0.00)
- SR values show inverse correlation with RMS (higher SR = lower RMS)
- Layer 0 consistently shows highest variability across all models
2. **Color Pattern Analysis:**
- RWKV-5 heatmaps display dominant red/blue regions indicating strong positive/negative values
- RWKV-6 shows reduced color intensity compared to RWKV-5
- RWKV-7 heatmaps appear nearly uniform (minimal color variation)
3. **Layer-Specific Behavior:**
- Layer 0 (input processing) maintains highest variability across all models
- Layer 12 (mid-depth) shows progressive stabilization
- Layer 21 (output processing) demonstrates most consistent behavior
### Interpretation
The visual progression from RWKV-5 to RWKV-7 reveals significant architectural improvements in matrix stability:
- **RMS Reduction**: The near-zero RMS in RWKV-7 suggests near-perfect value distribution, indicating optimized weight initialization or training
- **SR Correlation**: The inverse relationship between SR and RMS implies that better scaling (lower SR) leads to more stable value distributions
- **Layer Specialization**: The consistent high variability in Layer 0 across all models suggests this layer retains critical input processing characteristics that resist optimization
- **Color Intensity**: The dramatic reduction in color variation from RWKV-5 to RWKV-7 visually confirms the quantitative RMS improvements
These patterns suggest that later RWKV versions achieve better weight initialization or training stability, resulting in more consistent matrix value distributions while maintaining effective scaling properties.