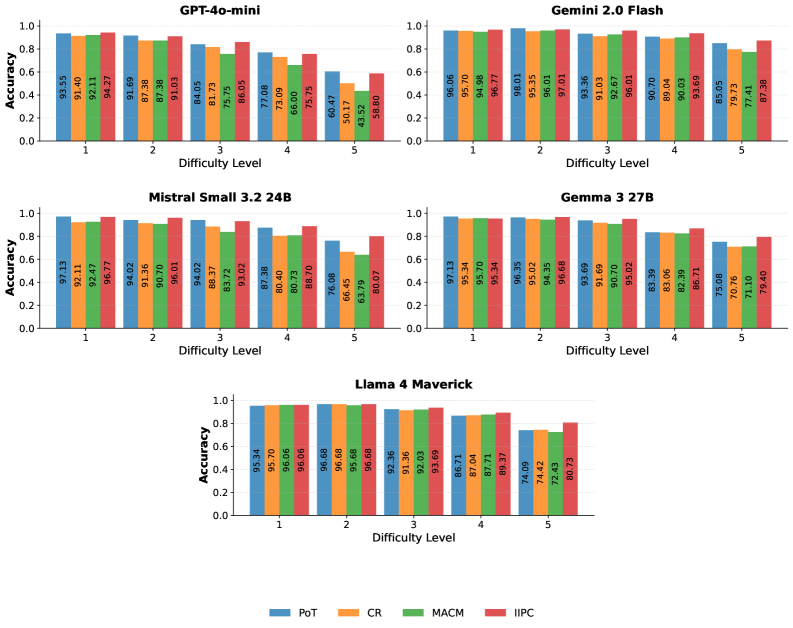
## Bar Chart: Model Accuracy vs. Difficulty Level
### Overview
The image presents a series of bar charts comparing the accuracy of different language models (GPT-4o-mini, Gemini 2.0 Flash, Mistral Small 3.2 24B, Gemma 3 27B, and Llama 4 Maverick) across five difficulty levels. Each chart displays the accuracy achieved by four different methods (PoT, CR, MACM, and IIPC) for each difficulty level.
### Components/Axes
* **Title:** Each chart has a title indicating the language model being evaluated (e.g., "GPT-4o-mini").
* **X-axis:** "Difficulty Level" with values 1 to 5.
* **Y-axis:** "Accuracy" ranging from 0.0 to 1.0.
* **Legend:** Located at the bottom of the image, mapping colors to methods:
* Blue: PoT
* Orange: CR
* Green: MACM
* Red: IIPC
### Detailed Analysis
#### GPT-4o-mini
* **Trend:** Accuracy generally decreases as difficulty level increases for all methods.
* **PoT (Blue):** Starts at 93.55% at difficulty 1, decreasing to 60.47% at difficulty 5.
* **CR (Orange):** Starts at 91.40% at difficulty 1, decreasing to 50.17% at difficulty 5.
* **MACM (Green):** Starts at 92.11% at difficulty 1, decreasing to 43.52% at difficulty 5.
* **IIPC (Red):** Starts at 94.27% at difficulty 1, decreasing to 58.80% at difficulty 5.
#### Gemini 2.0 Flash
* **Trend:** Accuracy remains relatively high across all difficulty levels, with a slight decrease at higher levels.
* **PoT (Blue):** Starts at 96.06% at difficulty 1, decreasing to 85.05% at difficulty 5.
* **CR (Orange):** Starts at 95.70% at difficulty 1, decreasing to 79.73% at difficulty 5.
* **MACM (Green):** Starts at 94.98% at difficulty 1, decreasing to 77.41% at difficulty 5.
* **IIPC (Red):** Starts at 96.77% at difficulty 1, decreasing to 87.38% at difficulty 5.
#### Mistral Small 3.2 24B
* **Trend:** Accuracy decreases as difficulty level increases for all methods.
* **PoT (Blue):** Starts at 97.13% at difficulty 1, decreasing to 76.08% at difficulty 5.
* **CR (Orange):** Starts at 92.11% at difficulty 1, decreasing to 66.45% at difficulty 5.
* **MACM (Green):** Starts at 92.47% at difficulty 1, decreasing to 63.79% at difficulty 5.
* **IIPC (Red):** Starts at 96.77% at difficulty 1, decreasing to 80.07% at difficulty 5.
#### Gemma 3 27B
* **Trend:** Accuracy decreases as difficulty level increases for all methods.
* **PoT (Blue):** Starts at 97.13% at difficulty 1, decreasing to 75.08% at difficulty 5.
* **CR (Orange):** Starts at 95.34% at difficulty 1, decreasing to 70.76% at difficulty 5.
* **MACM (Green):** Starts at 95.70% at difficulty 1, decreasing to 71.10% at difficulty 5.
* **IIPC (Red):** Starts at 95.34% at difficulty 1, decreasing to 79.40% at difficulty 5.
#### Llama 4 Maverick
* **Trend:** Accuracy remains relatively high until difficulty level 4, then decreases.
* **PoT (Blue):** Starts at 95.34% at difficulty 1, decreasing to 74.09% at difficulty 5.
* **CR (Orange):** Starts at 95.70% at difficulty 1, decreasing to 74.42% at difficulty 5.
* **MACM (Green):** Starts at 96.06% at difficulty 1, decreasing to 72.43% at difficulty 5.
* **IIPC (Red):** Starts at 96.06% at difficulty 1, decreasing to 80.73% at difficulty 5.
### Key Observations
* **General Trend:** Most models show a decrease in accuracy as the difficulty level increases.
* **Model Performance:** Gemini 2.0 Flash generally maintains higher accuracy across all difficulty levels compared to the other models. GPT-4o-mini shows the most significant drop in accuracy as difficulty increases.
* **Method Comparison:** The relative performance of PoT, CR, MACM, and IIPC varies across models and difficulty levels, but there isn't a consistently superior method.
### Interpretation
The charts illustrate how the accuracy of different language models is affected by the difficulty of the task. The decreasing accuracy with increasing difficulty suggests that these models struggle with more complex problems. Gemini 2.0 Flash appears to be more robust to increasing difficulty compared to the other models tested. The different methods (PoT, CR, MACM, IIPC) represent different approaches to solving the tasks, and their varying performance highlights the importance of selecting the appropriate method for a given model and task difficulty. The significant drop in accuracy for GPT-4o-mini at higher difficulty levels suggests that this model may be more sensitive to task complexity than the others.