## Line Chart: Run Family Accuracy vs. Training Steps
### Overview
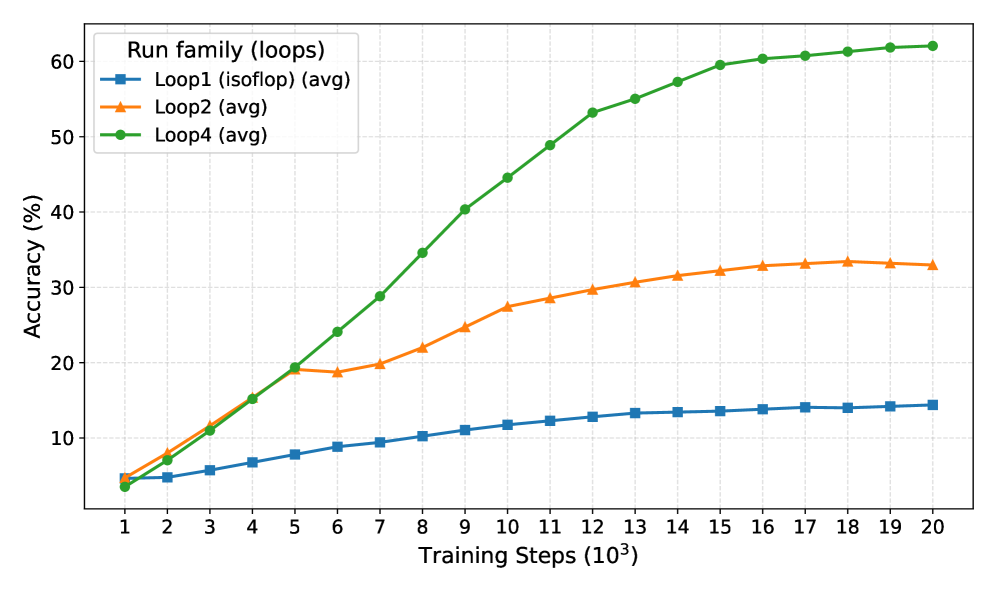
The image is a line chart comparing the accuracy of three different loop configurations (Loop1, Loop2, and Loop4) as a function of training steps. The x-axis represents training steps in thousands, ranging from 1 to 20. The y-axis represents accuracy in percentage, ranging from 0 to 60. The chart displays how the accuracy of each loop configuration changes with increasing training steps.
### Components/Axes
* **Title:** Run family (loops)
* **X-axis Title:** Training Steps (10^3)
* **X-axis Markers:** 1, 2, 3, 4, 5, 6, 7, 8, 9, 10, 11, 12, 13, 14, 15, 16, 17, 18, 19, 20
* **Y-axis Title:** Accuracy (%)
* **Y-axis Markers:** 10, 20, 30, 40, 50, 60
* **Legend:** Located in the top-left corner.
* **Loop1 (isoflop) (avg):** Blue line with square markers.
* **Loop2 (avg):** Orange line with triangle markers.
* **Loop4 (avg):** Green line with circle markers.
### Detailed Analysis
* **Loop1 (isoflop) (avg):** The blue line starts at approximately 4% accuracy at 1,000 training steps. It increases gradually and plateaus around 14% accuracy after approximately 13,000 training steps.
* (1, 4%)
* (5, 9%)
* (10, 12%)
* (15, 14%)
* (20, 14%)
* **Loop2 (avg):** The orange line starts at approximately 5% accuracy at 1,000 training steps. It increases more rapidly than Loop1 initially, reaching a peak of approximately 33% accuracy around 17,000 training steps, then slightly decreases.
* (1, 5%)
* (5, 20%)
* (10, 28%)
* (15, 33%)
* (20, 32%)
* **Loop4 (avg):** The green line starts at approximately 4% accuracy at 1,000 training steps. It increases rapidly until approximately 15,000 training steps, reaching approximately 61% accuracy, and then plateaus.
* (1, 4%)
* (5, 25%)
* (10, 48%)
* (15, 61%)
* (20, 62%)
### Key Observations
* Loop4 consistently outperforms Loop2 and Loop1 in terms of accuracy across all training steps.
* Loop1 shows the lowest accuracy and plateaus early.
* Loop2 initially increases faster than Loop1 but plateaus and even slightly decreases towards the end.
* Loop4 shows the most significant improvement in accuracy with increasing training steps.
### Interpretation
The data suggests that Loop4 is the most effective configuration for this particular task, as it achieves the highest accuracy with increasing training steps. Loop1 appears to be the least effective, showing minimal improvement with more training. Loop2 shows moderate improvement but plateaus and slightly declines, indicating it may not benefit from extended training. The chart demonstrates the impact of different loop configurations on the accuracy of the model, highlighting the importance of selecting an appropriate configuration for optimal performance. The "isoflop" configuration (Loop1) seems to be the least effective.