\n
## Line Chart: Accuracy vs. Training Steps for Different Loop Families
### Overview
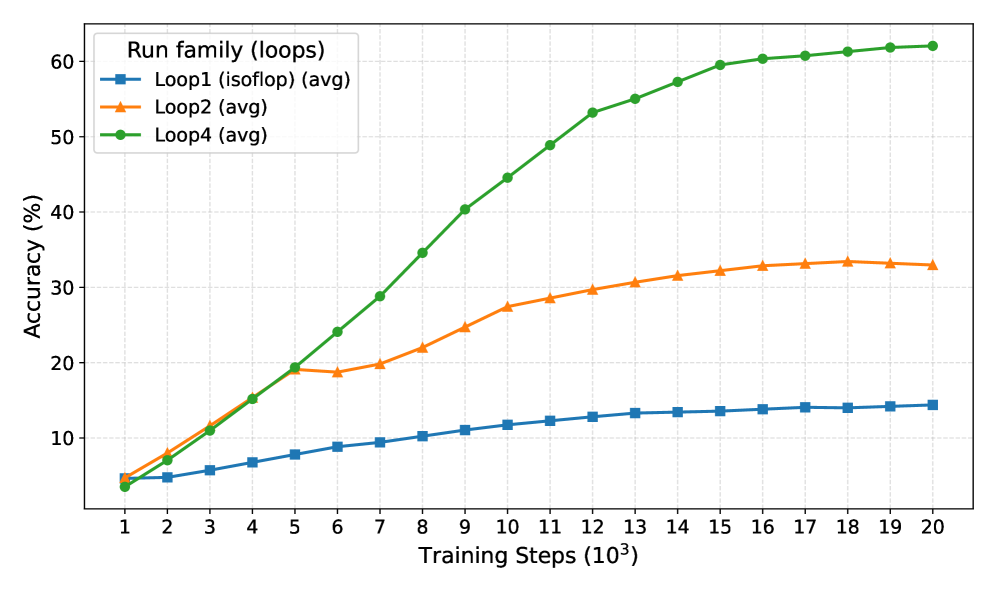
This line chart depicts the relationship between training steps and accuracy for three different loop families (Loop1, Loop2, and Loop4). The accuracy is measured in percentage, and the training steps are expressed in units of 10^3. The chart visually compares the performance of each loop family as training progresses.
### Components/Axes
* **X-axis Title:** Training Steps (10^3)
* Scale: 1 to 20, with markers at each integer value.
* **Y-axis Title:** Accuracy (%)
* Scale: 0 to 60, with markers at intervals of 10.
* **Legend:** Located in the top-left corner.
* Loop1 (isoflop) (avg) - Orange line
* Loop2 (avg) - Yellow line
* Loop4 (avg) - Green line
* **Data Series:** Three distinct lines representing the accuracy of each loop family over the training steps.
### Detailed Analysis
* **Loop1 (Orange):** The orange line starts at approximately 5% accuracy at 10^3 training steps and gradually increases, reaching around 33% accuracy at 20 x 10^3 training steps. The slope is relatively shallow, indicating a slower rate of improvement.
* **Loop2 (Yellow):** The yellow line begins at approximately 5% accuracy at 10^3 training steps and shows a more rapid increase initially, leveling off around 33% accuracy at 10 x 10^3 training steps. It remains relatively stable at this level for the remainder of the training period.
* **Loop4 (Green):** The green line starts at approximately 5% accuracy at 10^3 training steps and exhibits the most significant and rapid increase in accuracy. It reaches approximately 61% accuracy at 20 x 10^3 training steps. The slope is steep, indicating a fast rate of improvement.
Here's a more detailed breakdown of data points (approximate values):
| Training Steps (10^3) | Loop1 Accuracy (%) | Loop2 Accuracy (%) | Loop4 Accuracy (%) |
|---|---|---|---|
| 1 | 5 | 5 | 5 |
| 2 | 8 | 10 | 12 |
| 3 | 12 | 17 | 22 |
| 4 | 16 | 23 | 32 |
| 5 | 19 | 27 | 41 |
| 6 | 22 | 30 | 48 |
| 7 | 25 | 32 | 53 |
| 8 | 27 | 33 | 56 |
| 9 | 29 | 33 | 58 |
| 10 | 30 | 33 | 59 |
| 11 | 31 | 33 | 60 |
| 12 | 32 | 33 | 60 |
| 13 | 32 | 33 | 60 |
| 14 | 33 | 33 | 61 |
| 15 | 33 | 33 | 61 |
| 16 | 33 | 33 | 61 |
| 17 | 33 | 33 | 61 |
| 18 | 33 | 33 | 61 |
| 19 | 33 | 33 | 61 |
| 20 | 33 | 33 | 61 |
### Key Observations
* Loop4 consistently outperforms Loop1 and Loop2 in terms of accuracy throughout the entire training period.
* Loop2 reaches a plateau in accuracy relatively early in the training process, while Loop1 continues to improve, albeit at a slower rate.
* Loop1 shows the slowest rate of improvement.
* All three loops start with the same accuracy.
### Interpretation
The data suggests that Loop4 is the most effective loop family for achieving high accuracy in this training scenario. The rapid increase in accuracy for Loop4 indicates that it learns more efficiently from the training data. Loop2, while initially showing a faster increase than Loop1, quickly reaches a point of diminishing returns. Loop1's slow improvement suggests it may require significantly more training steps to achieve comparable accuracy to Loop4.
The differences in performance between the loop families could be attributed to various factors, such as the underlying algorithms, the optimization techniques used, or the specific hyperparameters employed. Further investigation would be needed to determine the root causes of these differences. The "isoflop" designation for Loop1 suggests a specific computational characteristic that may be influencing its performance. The use of "avg" in the legend indicates that the accuracy values represent averages across multiple runs, which helps to mitigate the impact of random variations.