## Chart: Action Probability vs. Time Period for Greedy Algorithm and Thompson Sampling
### Overview
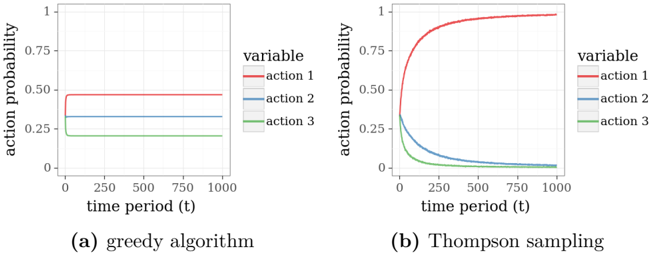
The image presents two line charts comparing the action probabilities over time for a greedy algorithm and Thompson sampling. Each chart displays three actions (action 1, action 2, and action 3) with their probabilities plotted against the time period.
### Components/Axes
* **Left Chart (a) - Greedy Algorithm:**
* X-axis: "time period (t)" ranging from 0 to 1000.
* Y-axis: "action probability" ranging from 0 to 1.
* Legend (top-right):
* Red: "action 1"
* Blue: "action 2"
* Green: "action 3"
* **Right Chart (b) - Thompson Sampling:**
* X-axis: "time period (t)" ranging from 0 to 1000.
* Y-axis: "action probability" ranging from 0 to 1.
* Legend (top-right):
* Red: "action 1"
* Blue: "action 2"
* Green: "action 3"
### Detailed Analysis
**Left Chart (a) - Greedy Algorithm:**
* **Action 1 (Red):** Starts at approximately 0.45 at time period 0, quickly rises to approximately 0.50, and remains relatively constant around 0.50 for the rest of the time period.
* **Action 2 (Blue):** Starts at approximately 0.35 at time period 0 and remains relatively constant around 0.35 for the rest of the time period.
* **Action 3 (Green):** Starts at approximately 0.20 at time period 0 and remains relatively constant around 0.20 for the rest of the time period.
**Right Chart (b) - Thompson Sampling:**
* **Action 1 (Red):** Starts at approximately 0.45 at time period 0, rapidly increases to approximately 0.98, and remains relatively constant around 0.98 for the rest of the time period.
* **Action 2 (Blue):** Starts at approximately 0.35 at time period 0, rapidly decreases to approximately 0.02, and remains relatively constant around 0.02 for the rest of the time period.
* **Action 3 (Green):** Starts at approximately 0.20 at time period 0, rapidly decreases to approximately 0.01, and remains relatively constant around 0.01 for the rest of the time period.
### Key Observations
* In the greedy algorithm, the action probabilities remain relatively stable over time.
* In Thompson sampling, action 1 quickly dominates, while actions 2 and 3 diminish rapidly.
### Interpretation
The charts illustrate the difference in behavior between a greedy algorithm and Thompson sampling in a multi-armed bandit problem. The greedy algorithm explores all actions with relatively stable probabilities, while Thompson sampling quickly converges to a single action (action 1) and exploits it, suppressing the probabilities of the other actions. This demonstrates Thompson sampling's ability to quickly identify and exploit the most rewarding action, while the greedy algorithm maintains a more balanced exploration strategy.