## Line Graphs: Action Probability Over Time for Greedy Algorithm and Thompson Sampling
### Overview
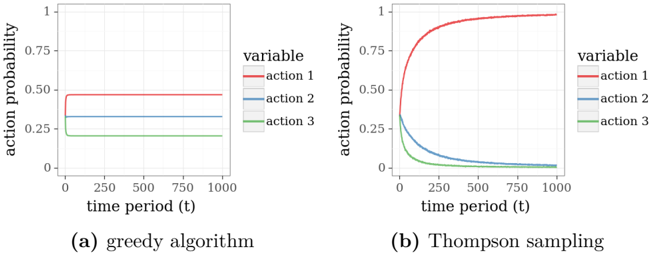
The image contains two line graphs comparing action probabilities over time for two decision-making algorithms: (a) a greedy algorithm and (b) Thompson sampling. Both graphs show three actions (action 1, 2, 3) with probabilities plotted against time periods (t) from 0 to 1000. The y-axis represents action probability (0–1), and the x-axis represents time periods.
---
### Components/Axes
1. **Graph (a): Greedy Algorithm**
- **X-axis**: Time period (t) ranging from 0 to 1000.
- **Y-axis**: Action probability (0–1).
- **Legend**:
- Red: Action 1
- Blue: Action 2
- Green: Action 3
- **Lines**:
- Action 1 (red): Flat line at ~0.5 probability.
- Action 2 (blue): Flat line at ~0.25 probability.
- Action 3 (green): Flat line at ~0.25 probability.
2. **Graph (b): Thompson Sampling**
- **X-axis**: Time period (t) ranging from 0 to 1000.
- **Y-axis**: Action probability (0–1).
- **Legend**:
- Red: Action 1
- Blue: Action 2
- Green: Action 3
- **Lines**:
- Action 1 (red): Sharp rise from 0 to 1 by ~250 time periods, then flat.
- Action 2 (blue): Rises to ~0.25 by ~250, then declines to 0.
- Action 3 (green): Rises to ~0.25 by ~250, then declines to 0.
---
### Detailed Analysis
#### Graph (a): Greedy Algorithm
- **Action 1 (red)**: Maintains a constant probability of ~0.5 across all time periods.
- **Action 2 (blue)**: Maintains a constant probability of ~0.25 across all time periods.
- **Action 3 (green)**: Maintains a constant probability of ~0.25 across all time periods.
- **Total Probability**: Sums to 1.0 (0.5 + 0.25 + 0.25), indicating mutually exclusive actions.
#### Graph (b): Thompson Sampling
- **Action 1 (red)**:
- Probability starts at 0, sharply increases to 1 by ~250 time periods.
- Remains at 1 for the remainder of the time period.
- **Action 2 (blue)**:
- Probability starts at 0, rises to ~0.25 by ~250 time periods.
- Declines linearly to ~0 by ~1000 time periods.
- **Action 3 (green)**:
- Probability starts at 0, rises to ~0.25 by ~250 time periods.
- Declines linearly to ~0 by ~1000 time periods.
- **Total Probability**: Sums to 1.0 initially (0.25 + 0.25 + 0.5 = 1.0) and remains consistent as Action 1 dominates.
---
### Key Observations
1. **Greedy Algorithm**:
- No exploration: Probabilities for all actions remain static over time.
- Action 1 is favored with a fixed 50% probability, while Actions 2 and 3 share the remaining 50% equally.
2. **Thompson Sampling**:
- Exploratory phase: All actions have non-zero probabilities initially.
- Exploitative phase: Action 1 dominates after ~250 time periods, while Actions 2 and 3 are abandoned.
- Rapid convergence to a single optimal action (Action 1).
---
### Interpretation
The graphs illustrate fundamental differences between greedy and Thompson sampling strategies:
1. **Greedy Algorithm**:
- Prioritizes immediate rewards without exploration, leading to suboptimal long-term performance if initial assumptions about action values are incorrect.
- The fixed probabilities suggest a lack of adaptability to changing environments.
2. **Thompson Sampling**:
- Balances exploration and exploitation by dynamically updating action probabilities based on observed outcomes.
- The sharp rise in Action 1’s probability indicates rapid identification of the optimal action, while Actions 2 and 3 are phased out as inferior.
- This aligns with Bayesian optimization principles, where uncertainty decreases over time, favoring the most promising action.
The data suggests that Thompson sampling outperforms the greedy algorithm in dynamic environments by adapting to new information, whereas the greedy algorithm risks stagnation due to its rigid strategy.