\n
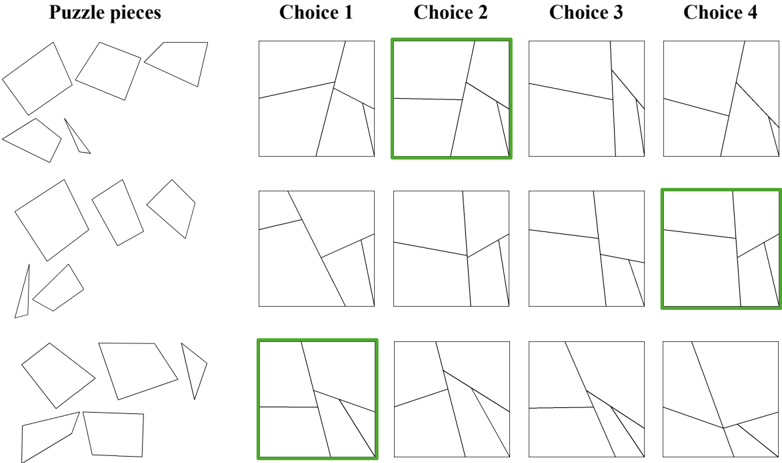
## Diagram: Puzzle Piece Matching
### Overview
The image presents a puzzle-solving task. It displays three sets of puzzle pieces on the left, and for each set, four possible arrangements of those pieces within a square frame on the right. Some of the correct arrangements are highlighted with a green border. The purpose appears to be to identify the correct arrangement of puzzle pieces.
### Components/Axes
The diagram is organized into two main columns: "Puzzle pieces" and "Choice 1" through "Choice 4". Each row represents a different puzzle set. There are no explicit axes or scales. The diagram relies on visual comparison.
### Detailed Analysis or Content Details
The diagram consists of three rows, each with a set of puzzle pieces on the left and four possible solutions on the right.
* **Row 1:**
* Puzzle Pieces: Four pieces, roughly trapezoidal and triangular shapes.
* Choice 2 is highlighted with a green border.
* **Row 2:**
* Puzzle Pieces: Four pieces, with more irregular shapes.
* Choice 4 is highlighted with a green border.
* **Row 3:**
* Puzzle Pieces: Four pieces, similar to the first set but with slight variations in shape.
* Choice 3 is highlighted with a green border.
The puzzle pieces in each row are distinct, and the arrangements in the "Choice" columns vary. The green borders indicate the correct solutions for each puzzle set.
### Key Observations
The diagram demonstrates a visual matching task. The correct solutions are not immediately obvious and require careful comparison of the puzzle piece shapes and their arrangement within the square frame. The green borders serve as the answer key.
### Interpretation
This diagram likely represents a cognitive assessment or a test of spatial reasoning skills. It assesses the ability to mentally manipulate shapes and determine how they fit together. The task requires visual attention to detail and the ability to recognize patterns. The use of a green border to highlight the correct answers suggests a binary evaluation – either the arrangement is correct or it is not. The varying complexity of the puzzle pieces across the rows could indicate different levels of difficulty. The diagram is a straightforward presentation of a problem-solving task, designed to evaluate a specific cognitive ability.