## Bar Chart: Accuracy Comparison Across Different Data Representation Strategies
### Overview
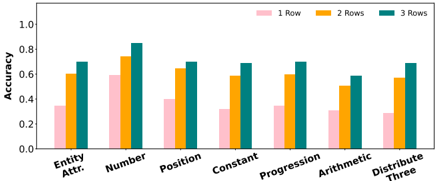
The chart compares the accuracy of three data representation strategies (1 Row, 2 Rows, 3 Rows) across seven categories: Entity Attr., Number, Position, Constant, Progression, Arithmetic, and Distribute Three. Accuracy is measured on a scale from 0.0 to 1.0.
### Components/Axes
- **X-Axis (Categories)**: Entity Attr., Number, Position, Constant, Progression, Arithmetic, Distribute Three.
- **Y-Axis (Accuracy)**: Scale from 0.0 to 1.0.
- **Legend**:
- Pink: 1 Row
- Orange: 2 Rows
- Teal: 3 Rows
- **Bar Colors**:
- 1 Row (pink), 2 Rows (orange), 3 Rows (teal).
### Detailed Analysis
1. **Entity Attr.**
- 1 Row: ~0.35
- 2 Rows: ~0.60
- 3 Rows: ~0.70
2. **Number**
- 1 Row: ~0.60
- 2 Rows: ~0.75
- 3 Rows: ~0.85
3. **Position**
- 1 Row: ~0.40
- 2 Rows: ~0.65
- 3 Rows: ~0.70
4. **Constant**
- 1 Row: ~0.30
- 2 Rows: ~0.60
- 3 Rows: ~0.70
5. **Progression**
- 1 Row: ~0.35
- 2 Rows: ~0.60
- 3 Rows: ~0.70
6. **Arithmetic**
- 1 Row: ~0.30
- 2 Rows: ~0.50
- 3 Rows: ~0.60
7. **Distribute Three**
- 1 Row: ~0.25
- 2 Rows: ~0.55
- 3 Rows: ~0.70
### Key Observations
- **Trend Verification**:
- All categories show increasing accuracy with more rows (1 → 2 → 3 Rows).
- The "Number" category has the highest absolute accuracy (0.85 for 3 Rows).
- The "Arithmetic" category has the lowest accuracy across all strategies.
- **Outliers**:
- "Distribute Three" (1 Row) has the lowest accuracy (~0.25).
- "Number" (3 Rows) has the highest accuracy (~0.85).
### Interpretation
The data demonstrates that increasing the number of rows (data points) consistently improves accuracy across all categories. The "Number" category benefits most from additional rows, achieving near-perfect accuracy (0.85) with 3 Rows. Conversely, the "Arithmetic" category remains the weakest, with accuracy plateauing at ~0.60 even with 3 Rows. This suggests that arithmetic operations may require specialized handling or additional contextual data to improve performance. The "Distribute Three" category shows the largest gap between strategies, indicating it may be particularly sensitive to data representation complexity.