## Line Charts: NMSE vs. Iteration for Different Models and Datasets
### Overview
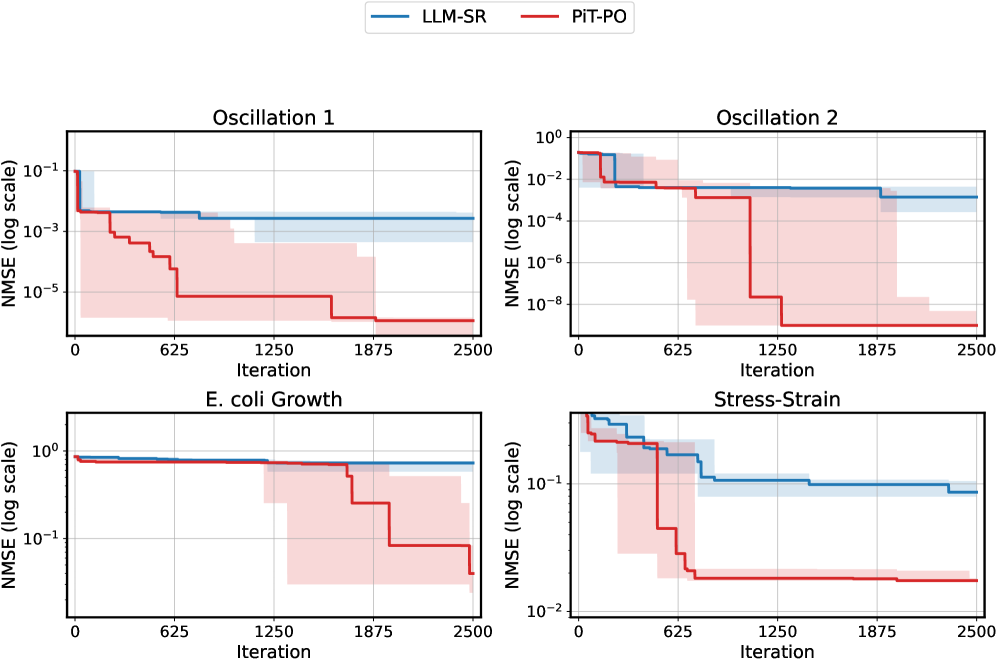
The image contains four line charts arranged in a 2x2 grid. Each chart plots the Normalized Mean Squared Error (NMSE) on a logarithmic scale against the iteration number. The charts compare the performance of two models, LLM-SR (blue) and PiT-PO (red), across four different datasets: Oscillation 1, Oscillation 2, E. coli Growth, and Stress-Strain. Each line is surrounded by a shaded region of the same color, representing the uncertainty or variance in the model's performance.
### Components/Axes
* **X-axis (all charts):** Iteration, with tick marks at 0, 625, 1250, 1875, and 2500.
* **Y-axis (all charts):** NMSE (log scale). The y-axis scales vary slightly between charts.
* Oscillation 1: 10^-5 to 10^-1
* Oscillation 2: 10^-8 to 10^0
* E. coli Growth: 10^-1 to 10^0
* Stress-Strain: 10^-2 to 10^0
* **Titles (each chart):**
* Top-left: Oscillation 1
* Top-right: Oscillation 2
* Bottom-left: E. coli Growth
* Bottom-right: Stress-Strain
* **Legend (top center):**
* LLM-SR (blue line and shaded region)
* PiT-PO (red line and shaded region)
### Detailed Analysis
**Oscillation 1:**
* **LLM-SR (blue):** Starts at approximately 10^-2 and remains relatively constant, with a slight decrease, fluctuating between 10^-2 and 10^-3.
* **PiT-PO (red):** Starts at approximately 10^-1, then decreases stepwise to approximately 10^-5 by iteration 1875, remaining constant thereafter.
* Step 1: From 10^-1 to 10^-3 by iteration 625
* Step 2: From 10^-3 to 10^-5 by iteration 1875
**Oscillation 2:**
* **LLM-SR (blue):** Starts at approximately 10^-2 and remains relatively constant, fluctuating between 10^-2 and 10^-3.
* **PiT-PO (red):** Starts at approximately 10^-2, then decreases stepwise to approximately 10^-8 by iteration 1250, remaining constant thereafter.
* Step 1: From 10^-2 to 10^-3 by iteration 625
* Step 2: From 10^-3 to 10^-8 by iteration 1250
**E. coli Growth:**
* **LLM-SR (blue):** Starts at approximately 10^0 and remains relatively constant, fluctuating between 10^-0 and 10^-1.
* **PiT-PO (red):** Starts at approximately 10^0, then decreases stepwise to approximately 10^-1 by iteration 1875, remaining constant thereafter.
* Step 1: From 10^0 to 10^-1 by iteration 1875
**Stress-Strain:**
* **LLM-SR (blue):** Starts at approximately 10^0, then decreases stepwise to approximately 10^-1 by iteration 625, remaining constant thereafter.
* Step 1: From 10^0 to 10^-1 by iteration 625
* **PiT-PO (red):** Starts at approximately 10^0, then decreases stepwise to approximately 10^-2 by iteration 625, remaining constant thereafter.
* Step 1: From 10^0 to 10^-1 by iteration 625
* Step 2: From 10^-1 to 10^-2 by iteration 625
### Key Observations
* In all four datasets, the PiT-PO model (red) generally achieves a lower NMSE than the LLM-SR model (blue), indicating better performance.
* The PiT-PO model exhibits a stepwise decrease in NMSE, suggesting discrete improvements at specific iterations.
* The LLM-SR model tends to maintain a more stable NMSE, with less fluctuation.
* The shaded regions around the lines indicate the variability in the model's performance across multiple runs or trials.
### Interpretation
The charts demonstrate the performance of two different models (LLM-SR and PiT-PO) on four different datasets. The PiT-PO model consistently outperforms the LLM-SR model in terms of NMSE, suggesting that it is a more effective model for these tasks. The stepwise decrease in NMSE for the PiT-PO model may indicate specific iterations where the model learned significant features or adjusted its parameters effectively. The relatively stable NMSE of the LLM-SR model suggests that it may be less sensitive to changes in the data or optimization process. The shaded regions provide insight into the robustness and reliability of each model, with wider regions indicating greater variability in performance. Overall, the data suggests that the PiT-PO model is a better choice for these datasets, but further analysis may be needed to understand the specific factors that contribute to its superior performance.