## Line Graphs: NMSE Performance Across Tasks
### Overview
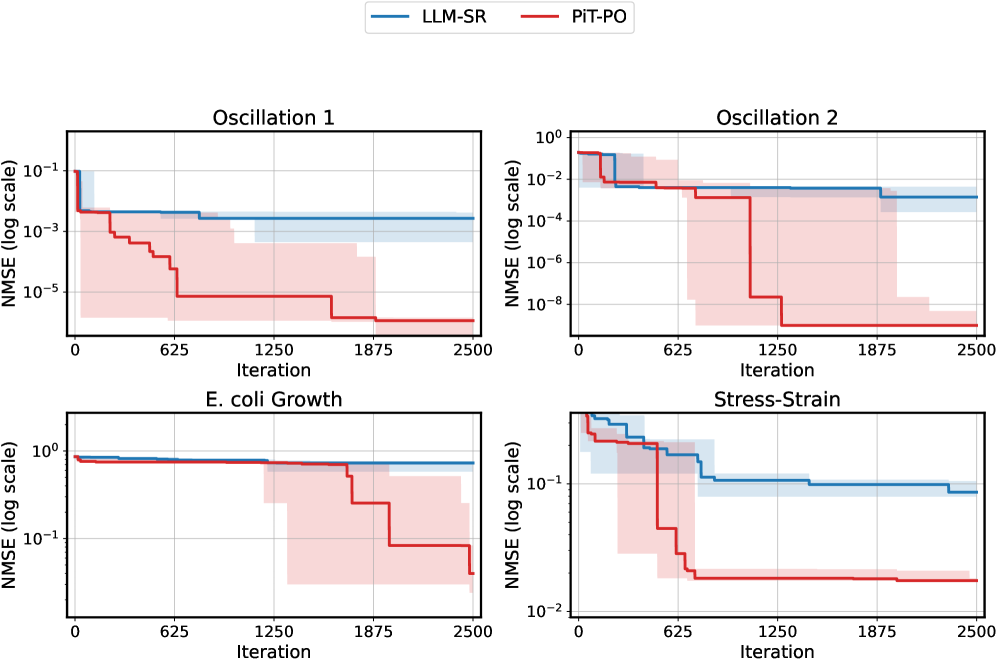
The image contains four line graphs arranged in a 2x2 grid, comparing the performance of two methods (LLM-SR and PiT-PO) across four tasks: Oscillation 1, Oscillation 2, E. coli Growth, and Stress-Strain. All graphs share identical axes labels and scales, with iterations (0–2500) on the x-axis and NMSE (log scale) on the y-axis. The legend identifies blue lines as LLM-SR and red lines as PiT-PO, with shaded regions representing uncertainty intervals.
---
### Components/Axes
- **X-axis**: Iteration (0–2500, linear scale).
- **Y-axis**: NMSE (log scale, 10⁻¹ to 10⁰).
- **Legend**:
- Blue: LLM-SR
- Red: PiT-PO
- **Shaded Regions**: Confidence intervals (wider at lower iterations, narrowing over time).
---
### Detailed Analysis
#### Oscillation 1
- **LLM-SR (Blue)**: Starts at ~10⁻¹, drops sharply to ~10⁻³ by iteration 625, then plateaus.
- **PiT-PO (Red)**: Starts at ~10⁻³, drops to ~10⁻⁵ by iteration 625, then plateaus.
- **Trend**: PiT-PO consistently outperforms LLM-SR after iteration 625. Both methods stabilize by iteration 1250.
#### Oscillation 2
- **LLM-SR (Blue)**: Starts at ~10⁻², drops to ~10⁻⁴ by iteration 625, then plateaus.
- **PiT-PO (Red)**: Starts at ~10⁻³, drops to ~10⁻⁵ by iteration 625, then plateaus.
- **Trend**: Similar to Oscillation 1, PiT-PO achieves lower NMSE earlier and maintains superiority.
#### E. coli Growth
- **LLM-SR (Blue)**: Starts near 10⁰, drops to ~10⁻¹ by iteration 625, then plateaus.
- **PiT-PO (Red)**: Starts near 10⁰, drops to ~10⁻¹ by iteration 625, then plateaus.
- **Trend**: Both methods converge at ~10⁻¹ by iteration 625, with PiT-PO showing slightly lower NMSE throughout.
#### Stress-Strain
- **LLM-SR (Blue)**: Starts at ~10⁻¹, drops to ~10⁻² by iteration 625, then plateaus.
- **PiT-PO (Red)**: Starts at ~10⁻², drops to ~10⁻³ by iteration 625, then plateaus.
- **Trend**: PiT-PO achieves lower NMSE earlier and maintains a consistent advantage.
---
### Key Observations
1. **Early Performance Drop**: All tasks show a sharp NMSE reduction (~1–2 orders of magnitude) around iteration 625 for both methods.
2. **Convergence**: By iteration 1250, NMSE values stabilize for both methods across all tasks.
3. **Method Comparison**: PiT-PO (red) consistently achieves lower NMSE than LLM-SR (blue) after iteration 625 in all tasks.
4. **Uncertainty**: Shaded regions (confidence intervals) are widest at early iterations, narrowing significantly by iteration 1250.
---
### Interpretation
The data demonstrates that **PiT-PO outperforms LLM-SR** in reducing NMSE across diverse tasks (oscillations, biological growth, mechanical stress). The early drop in NMSE (~iteration 625) suggests a critical adaptation phase where PiT-PO’s methodology (e.g., parameter tuning, model architecture) becomes more effective. The plateauing NMSE after iteration 1250 implies diminishing returns from further iterations. The narrowing confidence intervals indicate increasing model stability over time. These results highlight PiT-PO’s robustness in handling varied dynamical systems, with potential applications in predictive modeling where low NMSE is critical.