## Diagram: Matrix Transformation Flowchart
### Overview
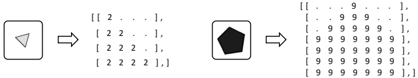
The image displays a two-step transformation process represented as a flowchart. It shows an initial 4x4 matrix being transformed into a 5x5 matrix through two intermediate geometric operations, symbolized by a triangle and a pentagon. The flow is indicated by right-pointing arrows.
### Components/Axes
The diagram consists of five distinct components arranged horizontally from left to right:
1. **Initial State (Leftmost):** A square box containing a left-pointing triangle symbol (◁).
2. **First Transformation Arrow:** A right-pointing arrow (→).
3. **Intermediate Matrix:** A 4x4 matrix of numbers.
4. **Second Transformation Arrow:** A right-pointing arrow (→).
5. **Final State (Rightmost):** A square box containing a solid pentagon symbol (⬟), followed by a 5x5 matrix of numbers.
### Detailed Analysis
**1. Initial Symbol:**
* A square outline containing a simple, unfilled triangle pointing to the left.
**2. First Arrow:**
* A standard right-pointing arrow, indicating a process or function is applied.
**3. Intermediate Matrix (4x4):**
* This is a 4-row by 4-column grid of numbers.
* **Row 1:** `[1, 2, ..., 1]` - The ellipsis (`...`) suggests a pattern, but the visible columns show the first element is `1`, the second is `2`, and the last is `1`.
* **Row 2:** `[2, 2, ..., 2]` - All visible elements are `2`.
* **Row 3:** `[2, 2, 2, 1]`
* **Row 4:** `[2, 2, 2, 1]`
* **Pattern Summary:** The matrix has `1`s at the four corners (positions (1,1), (1,4), (4,1), (4,4)). The rest of the first row and the entire second row are `2`s. The bottom-right 2x2 sub-matrix (rows 3-4, columns 3-4) is `[[2,1],[2,1]]`.
**4. Second Arrow:**
* Another right-pointing arrow, indicating a subsequent transformation.
**5. Final Symbol and Matrix (5x5):**
* A square outline containing a solid, black pentagon.
* **Matrix:** A 5-row by 5-column grid of numbers.
* **Row 1:** `[1, 9, 9, 9, 9]`
* **Row 2:** `[9, 9, 9, 9, 9]`
* **Row 3:** `[9, 9, 9, 9, 9]`
* **Row 4:** `[9, 9, 9, 9, 9]`
* **Row 5:** `[9, 9, 9, 9, 9]`
* **Pattern Summary:** The matrix contains a single `1` at the top-left corner (position (1,1)). All other 24 elements are `9`.
### Key Observations
1. **Dimension Change:** The matrix dimensions increase from 4x4 to 5x5.
2. **Value Transformation:** The numerical values change drastically. The initial matrix uses only `1` and `2`. The final matrix uses only `1` and `9`.
3. **Pattern Simplification:** The intermediate matrix has a more complex pattern of `1`s and `2`s. The final matrix has an extremely simple pattern: one `1` and the rest `9`s.
4. **Symbolic Progression:** The geometric symbols progress from a simple, unfilled triangle (3 sides) to a solid pentagon (5 sides). This may symbolize an increase in complexity, dimension, or a specific type of operation (e.g., a 3x3 kernel vs. a 5x5 kernel in image processing).
5. **Spatial Layout:** The elements are arranged in a strict left-to-right sequence, clearly defining a pipeline or algorithmic flow.
### Interpretation
This diagram likely illustrates a conceptual or mathematical transformation process, possibly from fields like linear algebra, computer graphics, or neural network operations.
* **What it Suggests:** The flow depicts an operation that takes an initial state (symbolized by the triangle), applies it to a structured data matrix (the 4x4 grid), and produces a new, larger, and more uniform data matrix (the 5x5 grid), with the nature of the operation perhaps indicated by the final pentagon symbol.
* **Relationship Between Elements:** The arrows define a strict causal or procedural relationship. The symbols (triangle, pentagon) are not merely labels but likely represent the *operators* or *functions* being applied to the data matrices. The change in matrix size and value distribution is the direct result of these operations.
* **Notable Anomalies/Patterns:** The most striking feature is the extreme homogenization in the final matrix. The transformation converts a mixed pattern of `1`s and `2`s into a field of `9`s with a single `1`. This could represent:
* A **padding operation** (e.g., adding a border of `9`s around the original data, with the `1` marking an anchor point).
* A **feature detection or filtering operation** where the pentagon symbol represents a filter that outputs a high response (`9`) everywhere except at one specific location.
* A **conceptual example** showing how a simple rule (triangle) applied to data can lead to a complex-looking but highly regular output (pentagon), emphasizing the power of iterative or layered transformations.
The diagram prioritizes showing the *structure of the transformation* (input → operation → intermediate data → operation → output) over providing specific numerical context. The exact mathematical meaning would depend on the accompanying technical text.