## Diagram: Numerical Pattern Representation
### Overview
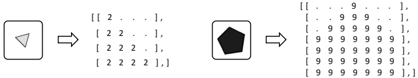
The image contains two distinct diagrams side-by-side. The left diagram features a triangle with a list of numbers in square brackets, while the right diagram shows a pentagon with a list of numbers. Both lists exhibit incremental growth in the number of elements, with the triangle's numbers being "2" and the pentagon's numbers being "9".
### Components/Axes
- **Left Diagram (Triangle)**:
- **Structure**: A triangle shape with four rows of numerical lists.
- **Labels**: Each row contains a list of "2"s, increasing in count from 1 to 4 elements.
- Row 1: `[2]`
- Row 2: `[2, 2]`
- Row 3: `[2, 2, 2]`
- Row 4: `[2, 2, 2, 2]`
- **Positioning**: Centered within a square boundary on the left side of the image.
- **Right Diagram (Pentagon)**:
- **Structure**: A pentagon shape with ten rows of numerical lists.
- **Labels**: Each row contains a list of "9"s, increasing in count from 1 to 10 elements.
- Row 1: `[9]`
- Row 2: `[9, 9]`
- Row 3: `[9, 9, 9]`
- ...
- Row 10: `[9, 9, 9, 9, 9, 9, 9, 9, 9, 9]`
- **Positioning**: Centered within a square boundary on the right side of the image.
### Detailed Analysis
- **Triangle Pattern**:
- The lists follow a strict incremental pattern, with each row adding one additional "2".
- The final row contains four "2"s, suggesting a progression from 1 to 4 elements.
- **Pentagon Pattern**:
- The lists follow a similar incremental pattern but extend to 10 elements.
- The final row contains ten "9"s, indicating a longer sequence compared to the triangle.
### Key Observations
1. **Symmetry in Structure**: Both diagrams use geometric shapes (triangle and pentagon) to frame their respective lists, possibly indicating categorical differentiation.
2. **Numerical Consistency**: The triangle uses only "2"s, while the pentagon uses only "9"s, suggesting distinct data sets or symbolic meanings.
3. **Growth Progression**: Both diagrams emphasize incremental growth, with the pentagon's sequence being twice as long as the triangle's.
### Interpretation
- **Purpose**: The diagrams likely represent abstract data sequences, where the geometric shapes (triangle/pentagon) symbolize categories or types of data. The incremental lists could model processes like accumulation, iteration, or hierarchical growth.
- **Symbolism**:
- The triangle (3 sides) might represent a base-3 or triangular number system, though the use of "2"s complicates this.
- The pentagon (5 sides) paired with "9"s could imply a countdown, maximum value, or a reference to a 9-based system (e.g., nonary).
- **Anomalies**: The absence of axis labels or legends leaves the exact context ambiguous. The choice of "2" and "9" may hold symbolic or algorithmic significance not immediately apparent.
### Final Notes
The image prioritizes visual representation of numerical growth over explicit contextual clues. Further analysis would require additional metadata to clarify the purpose of the shapes and numbers.