\n
## Charts: Cumulative Distribution Functions (CDFs) for Different Gamma Values
### Overview
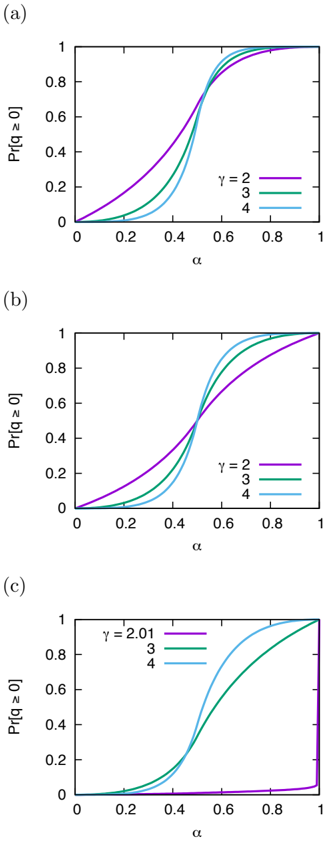
The image presents three separate charts (labeled a, b, and c) displaying cumulative distribution functions (CDFs). Each chart plots Pr(α > 0) against α, with different values of γ (gamma) represented by different colored lines. The charts appear to illustrate how the probability of α being greater than 0 changes as α increases, for varying γ values.
### Components/Axes
Each chart shares the following components:
* **X-axis:** Labeled "α" (alpha), ranging from 0 to 1.
* **Y-axis:** Labeled "Pr(α > 0)" (Probability that alpha is greater than 0), ranging from 0 to 1.
* **Legend:** Located in the top-right corner of each chart, indicating the γ (gamma) values corresponding to each line color. The γ values are 2, 3, and 4.
* **Chart Labels:** Each chart is labeled with a letter: (a), (b), and (c) in the top-left corner.
### Detailed Analysis or Content Details
**Chart (a):**
* **Cyan Line (γ = 2):** The line starts at approximately Pr(α > 0) = 0.1 at α = 0, and rises steadily, crossing Pr(α > 0) = 0.5 at approximately α = 0.35, and reaching Pr(α > 0) = 0.9 at α = 0.75.
* **Magenta Line (γ = 3):** The line starts at approximately Pr(α > 0) = 0.05 at α = 0, and rises more steeply than the cyan line, crossing Pr(α > 0) = 0.5 at approximately α = 0.25, and reaching Pr(α > 0) = 0.9 at α = 0.65.
* **Green Line (γ = 4):** The line starts at approximately Pr(α > 0) = 0.02 at α = 0, and rises even more steeply than the magenta line, crossing Pr(α > 0) = 0.5 at approximately α = 0.2, and reaching Pr(α > 0) = 0.9 at α = 0.6.
**Chart (b):**
* **Cyan Line (γ = 2):** The line starts at approximately Pr(α > 0) = 0.1 at α = 0, and rises steadily, crossing Pr(α > 0) = 0.5 at approximately α = 0.35, and reaching Pr(α > 0) = 0.9 at α = 0.75.
* **Magenta Line (γ = 3):** The line starts at approximately Pr(α > 0) = 0.05 at α = 0, and rises more steeply than the cyan line, crossing Pr(α > 0) = 0.5 at approximately α = 0.25, and reaching Pr(α > 0) = 0.9 at α = 0.65.
* **Green Line (γ = 4):** The line starts at approximately Pr(α > 0) = 0.02 at α = 0, and rises even more steeply than the magenta line, crossing Pr(α > 0) = 0.5 at approximately α = 0.2, and reaching Pr(α > 0) = 0.9 at α = 0.6.
**Chart (c):**
* **Cyan Line (γ = 2.01):** The line starts at approximately Pr(α > 0) = 0.1 at α = 0, and rises steadily, crossing Pr(α > 0) = 0.5 at approximately α = 0.35, and reaching Pr(α > 0) = 0.9 at α = 0.75.
* **Magenta Line (γ = 3):** The line starts at approximately Pr(α > 0) = 0.05 at α = 0, and rises more steeply than the cyan line, crossing Pr(α > 0) = 0.5 at approximately α = 0.25, and reaching Pr(α > 0) = 0.9 at α = 0.65.
* **Green Line (γ = 4):** The line starts at approximately Pr(α > 0) = 0.02 at α = 0, and rises even more steeply than the magenta line, crossing Pr(α > 0) = 0.5 at approximately α = 0.2, and reaching Pr(α > 0) = 0.9 at α = 0.6.
### Key Observations
* In all three charts, the lines representing higher γ values (3 and 4) exhibit steeper slopes than the line representing the lower γ value (2 or 2.01). This indicates that for higher γ values, the probability of α being greater than 0 increases more rapidly as α increases.
* The charts (a) and (b) are identical.
* The curves are all sigmoid in shape, characteristic of cumulative distribution functions.
### Interpretation
These charts demonstrate the effect of the γ parameter on the cumulative distribution of α. The γ parameter likely controls the shape of the underlying probability distribution. A higher γ value results in a distribution where the probability of α being greater than 0 increases more quickly with increasing α. This suggests that higher γ values correspond to distributions with a more concentrated probability mass at higher α values. The identical nature of charts (a) and (b) suggests a potential redundancy or a deliberate repetition for emphasis. The data suggests a relationship between the gamma value and the distribution of alpha, where a higher gamma value leads to a faster increase in the probability of alpha being greater than zero. This could be indicative of a more skewed or concentrated distribution for higher gamma values.