TECHNICAL ASSET FINGERPRINT
a0a93be8e558ca9eaec8986a
Click to view fullscreen
Press ESC or click to close
FOUND IN PAPERS
EXPERT: gemini-2.0-flash VERSION 1
RUNTIME: nugit/gemini/gemini-2.0-flash
INTEL_VERIFIED
## Line Charts: Model Accuracy Comparison
### Overview
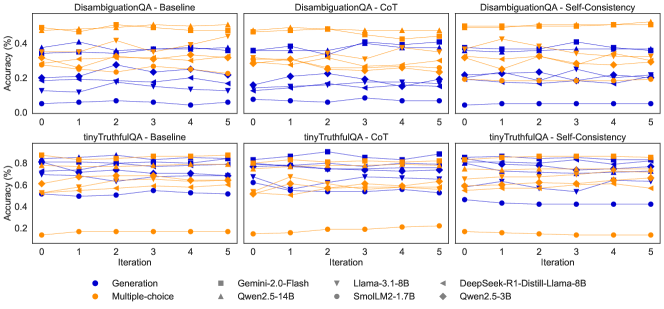
The image presents six line charts arranged in a 2x3 grid, comparing the accuracy of different language models across several iterations. The charts are grouped by task (DisambiguationQA and tinyTruthfulQA) and method (Baseline, CoT - Chain of Thought, and Self-Consistency). Each chart plots the accuracy (%) of various models against the iteration number. The models are distinguished by color and marker type, as indicated in the legend at the bottom.
### Components/Axes
* **Chart Titles (Top Row):**
* DisambiguationQA - Baseline (top-left)
* DisambiguationQA - CoT (top-center)
* DisambiguationQA - Self-Consistency (top-right)
* **Chart Titles (Bottom Row):**
* tinyTruthfulQA - Baseline (bottom-left)
* tinyTruthfulQA - CoT (bottom-center)
* tinyTruthfulQA - Self-Consistency (bottom-right)
* **Y-axis:**
* Label: "Accuracy (%)"
* Scale (DisambiguationQA charts): 0.0 to 0.4, with ticks at 0.0, 0.2, and 0.4.
* Scale (tinyTruthfulQA charts): 0.2 to 0.8, with ticks at 0.2, 0.4, 0.6, and 0.8.
* **X-axis:**
* Label: "Iteration"
* Scale: 0 to 5, with ticks at each integer value.
* **Legend (Bottom):**
* Position: Bottom center of the image.
* Entries:
* Blue Circle: Generation
* Orange Diamond: Multiple-choice
* Gray Square: Gemini-2.0-Flash
* Gray Upward-pointing Triangle: Qwen2.5-14B
* Gray Downward-pointing Triangle: Llama-3.1-8B
* Gray Circle with Diamond Center: SmolLM2-1.7B
* Gray Leftward-pointing Triangle: DeepSeek-R1-Distill-Llama-8B
* Gray Diamond with Plus Center: Qwen2.5-3B
### Detailed Analysis
**DisambiguationQA - Baseline (Top-Left)**
* **Generation (Blue Circles):** Starts around 0.05 accuracy and remains relatively flat.
* **Multiple-choice (Orange Diamonds):** Starts around 0.35 accuracy and fluctuates between 0.25 and 0.4.
* **Gemini-2.0-Flash (Gray Squares):** Starts around 0.25 accuracy and fluctuates between 0.2 and 0.3.
* **Qwen2.5-14B (Gray Upward-pointing Triangles):** Starts around 0.35 accuracy and fluctuates between 0.3 and 0.45.
* **Llama-3.1-8B (Gray Downward-pointing Triangles):** Starts around 0.2 accuracy and fluctuates between 0.15 and 0.25.
* **SmolLM2-1.7B (Gray Circle with Diamond Center):** Starts around 0.15 accuracy and fluctuates between 0.1 and 0.2.
* **DeepSeek-R1-Distill-Llama-8B (Gray Leftward-pointing Triangles):** Starts around 0.2 accuracy and fluctuates between 0.15 and 0.25.
* **Qwen2.5-3B (Gray Diamond with Plus Center):** Starts around 0.2 accuracy and fluctuates between 0.15 and 0.25.
**DisambiguationQA - CoT (Top-Center)**
* **Generation (Blue Circles):** Starts around 0.1 accuracy and remains relatively flat.
* **Multiple-choice (Orange Diamonds):** Starts around 0.3 accuracy and fluctuates between 0.25 and 0.4.
* **Gemini-2.0-Flash (Gray Squares):** Starts around 0.3 accuracy and fluctuates between 0.25 and 0.35.
* **Qwen2.5-14B (Gray Upward-pointing Triangles):** Starts around 0.35 accuracy and fluctuates between 0.3 and 0.45.
* **Llama-3.1-8B (Gray Downward-pointing Triangles):** Starts around 0.2 accuracy and fluctuates between 0.15 and 0.25.
* **SmolLM2-1.7B (Gray Circle with Diamond Center):** Starts around 0.2 accuracy and fluctuates between 0.15 and 0.25.
* **DeepSeek-R1-Distill-Llama-8B (Gray Leftward-pointing Triangles):** Starts around 0.2 accuracy and fluctuates between 0.15 and 0.25.
* **Qwen2.5-3B (Gray Diamond with Plus Center):** Starts around 0.2 accuracy and fluctuates between 0.15 and 0.25.
**DisambiguationQA - Self-Consistency (Top-Right)**
* **Generation (Blue Circles):** Starts around 0.1 accuracy and remains relatively flat.
* **Multiple-choice (Orange Diamonds):** Starts around 0.35 accuracy and fluctuates between 0.3 and 0.4.
* **Gemini-2.0-Flash (Gray Squares):** Starts around 0.3 accuracy and fluctuates between 0.25 and 0.35.
* **Qwen2.5-14B (Gray Upward-pointing Triangles):** Starts around 0.35 accuracy and fluctuates between 0.3 and 0.45.
* **Llama-3.1-8B (Gray Downward-pointing Triangles):** Starts around 0.2 accuracy and fluctuates between 0.15 and 0.25.
* **SmolLM2-1.7B (Gray Circle with Diamond Center):** Starts around 0.2 accuracy and fluctuates between 0.15 and 0.25.
* **DeepSeek-R1-Distill-Llama-8B (Gray Leftward-pointing Triangles):** Starts around 0.2 accuracy and fluctuates between 0.15 and 0.25.
* **Qwen2.5-3B (Gray Diamond with Plus Center):** Starts around 0.2 accuracy and fluctuates between 0.15 and 0.25.
**tinyTruthfulQA - Baseline (Bottom-Left)**
* **Generation (Blue Circles):** Starts around 0.5 accuracy and remains relatively flat.
* **Multiple-choice (Orange Diamonds):** Starts around 0.15 accuracy and remains relatively flat.
* **Gemini-2.0-Flash (Gray Squares):** Starts around 0.75 accuracy and fluctuates between 0.7 and 0.8.
* **Qwen2.5-14B (Gray Upward-pointing Triangles):** Starts around 0.8 accuracy and fluctuates between 0.75 and 0.85.
* **Llama-3.1-8B (Gray Downward-pointing Triangles):** Starts around 0.6 accuracy and fluctuates between 0.55 and 0.65.
* **SmolLM2-1.7B (Gray Circle with Diamond Center):** Starts around 0.6 accuracy and fluctuates between 0.55 and 0.65.
* **DeepSeek-R1-Distill-Llama-8B (Gray Leftward-pointing Triangles):** Starts around 0.7 accuracy and fluctuates between 0.65 and 0.75.
* **Qwen2.5-3B (Gray Diamond with Plus Center):** Starts around 0.6 accuracy and fluctuates between 0.55 and 0.65.
**tinyTruthfulQA - CoT (Bottom-Center)**
* **Generation (Blue Circles):** Starts around 0.5 accuracy and remains relatively flat.
* **Multiple-choice (Orange Diamonds):** Starts around 0.15 accuracy and remains relatively flat.
* **Gemini-2.0-Flash (Gray Squares):** Starts around 0.75 accuracy and fluctuates between 0.7 and 0.8.
* **Qwen2.5-14B (Gray Upward-pointing Triangles):** Starts around 0.8 accuracy and fluctuates between 0.75 and 0.85.
* **Llama-3.1-8B (Gray Downward-pointing Triangles):** Starts around 0.6 accuracy and fluctuates between 0.55 and 0.65.
* **SmolLM2-1.7B (Gray Circle with Diamond Center):** Starts around 0.6 accuracy and fluctuates between 0.55 and 0.65.
* **DeepSeek-R1-Distill-Llama-8B (Gray Leftward-pointing Triangles):** Starts around 0.7 accuracy and fluctuates between 0.65 and 0.75.
* **Qwen2.5-3B (Gray Diamond with Plus Center):** Starts around 0.6 accuracy and fluctuates between 0.55 and 0.65.
**tinyTruthfulQA - Self-Consistency (Bottom-Right)**
* **Generation (Blue Circles):** Starts around 0.5 accuracy and remains relatively flat.
* **Multiple-choice (Orange Diamonds):** Starts around 0.15 accuracy and remains relatively flat.
* **Gemini-2.0-Flash (Gray Squares):** Starts around 0.75 accuracy and fluctuates between 0.7 and 0.8.
* **Qwen2.5-14B (Gray Upward-pointing Triangles):** Starts around 0.8 accuracy and fluctuates between 0.75 and 0.85.
* **Llama-3.1-8B (Gray Downward-pointing Triangles):** Starts around 0.6 accuracy and fluctuates between 0.55 and 0.65.
* **SmolLM2-1.7B (Gray Circle with Diamond Center):** Starts around 0.6 accuracy and fluctuates between 0.55 and 0.65.
* **DeepSeek-R1-Distill-Llama-8B (Gray Leftward-pointing Triangles):** Starts around 0.7 accuracy and fluctuates between 0.65 and 0.75.
* **Qwen2.5-3B (Gray Diamond with Plus Center):** Starts around 0.6 accuracy and fluctuates between 0.55 and 0.65.
### Key Observations
* The "Multiple-choice" method (orange diamonds) consistently shows lower accuracy on the "tinyTruthfulQA" task compared to other models.
* The "Generation" method (blue circles) shows relatively low accuracy on the "DisambiguationQA" task, but higher accuracy on the "tinyTruthfulQA" task.
* The models Gemini-2.0-Flash, Qwen2.5-14B, DeepSeek-R1-Distill-Llama-8B, and Qwen2.5-3B generally achieve higher accuracy on the "tinyTruthfulQA" task.
* The accuracy of most models remains relatively stable across iterations, with only minor fluctuations.
* The CoT and Self-Consistency methods do not appear to significantly improve the accuracy compared to the Baseline method for most models.
### Interpretation
The charts compare the performance of different language models on two question-answering tasks ("DisambiguationQA" and "tinyTruthfulQA") using different methods (Baseline, Chain of Thought (CoT), and Self-Consistency). The data suggests that the choice of model and task significantly impacts accuracy. For instance, the "Multiple-choice" method seems less effective for the "tinyTruthfulQA" task, while the "Generation" method performs better on "tinyTruthfulQA" than on "DisambiguationQA". The relatively flat lines across iterations indicate that the models' performance does not significantly change with more iterations, suggesting that the models have reached a stable level of accuracy. The CoT and Self-Consistency methods, designed to improve reasoning, do not show a substantial advantage over the baseline, which could indicate that these tasks do not heavily rely on complex reasoning or that the models are not effectively utilizing these methods.
DECODING INTELLIGENCE...
EXPERT: nemotron-free VERSION 1
RUNTIME: free/nvidia/nemotron-nano-12b-v2-vl:free
INTEL_VERIFIED
## Line Graphs: Model Performance Across Prompting Methods
### Overview
The image contains six line graphs arranged in a 2x3 grid, comparing model accuracy across iterations (0-5) for two QA tasks: **DisambiguationQA** (top row) and **tinyTruthfulQA** (bottom row). Each graph evaluates three prompting methods: **Baseline**, **CoT (Chain-of-Thought)**, and **Self-Consistency**. Accuracy (%) is plotted on the y-axis, while iterations (0-5) are on the x-axis. Models are differentiated by color and marker type in the legend.
---
### Components/Axes
- **X-axis**: Iteration (0 to 5, integer steps).
- **Y-axis**: Accuracy (%) (0% to 80%, with increments of ~20%).
- **Legend**: Located at the bottom of all graphs. Models include:
- **Generation** (blue circles)
- **Multiple-choice** (orange squares)
- **Gemini 2.0-Flash** (gray squares)
- **Llama 3.1-8B** (gray triangles)
- **DeepSeek-R1-Distill-Llama-8B** (gray diamonds)
- **Qwen2.5-14B** (orange triangles)
- **SmolLM2-1.7B** (orange diamonds)
- **Qwen2.5-3B** (blue triangles)
---
### Detailed Analysis
#### DisambiguationQA - Baseline
- **Generation** (blue circles): Starts at ~0.3%, peaks at iteration 2 (~0.4%), then declines to ~0.2% by iteration 5.
- **Multiple-choice** (orange squares): Starts at ~0.1%, peaks at iteration 3 (~0.3%), then drops to ~0.2%.
- **Gemini 2.0-Flash** (gray squares): Stable at ~0.4% across all iterations.
- **Llama 3.1-8B** (gray triangles): Peaks at iteration 1 (~0.5%), then declines to ~0.3%.
- **DeepSeek-R1-Distill-Llama-8B** (gray diamonds): Stable at ~0.4%.
- **Qwen2.5-14B** (orange triangles): Starts at ~0.2%, peaks at iteration 3 (~0.3%), then drops to ~0.2%.
- **SmolLM2-1.7B** (orange diamonds): Stable at ~0.3%.
- **Qwen2.5-3B** (blue triangles): Stable at ~0.3%.
#### DisambiguationQA - CoT
- **Generation**: Peaks at iteration 2 (~0.4%), then declines to ~0.2%.
- **Multiple-choice**: Peaks at iteration 3 (~0.3%), then drops to ~0.2%.
- **Gemini 2.0-Flash**: Stable at ~0.4%.
- **Llama 3.1-8B**: Peaks at iteration 1 (~0.5%), then declines to ~0.3%.
- **DeepSeek-R1-Distill-Llama-8B**: Stable at ~0.4%.
- **Qwen2.5-14B**: Peaks at iteration 3 (~0.3%), then drops to ~0.2%.
- **SmolLM2-1.7B**: Stable at ~0.3%.
- **Qwen2.5-3B**: Stable at ~0.3%.
#### DisambiguationQA - Self-Consistency
- **Generation**: Peaks at iteration 2 (~0.4%), then declines to ~0.2%.
- **Multiple-choice**: Peaks at iteration 3 (~0.3%), then drops to ~0.2%.
- **Gemini 2.0-Flash**: Stable at ~0.4%.
- **Llama 3.1-8B**: Peaks at iteration 1 (~0.5%), then declines to ~0.3%.
- **DeepSeek-R1-Distill-Llama-8B**: Stable at ~0.4%.
- **Qwen2.5-14B**: Peaks at iteration 3 (~0.3%), then drops to ~0.2%.
- **SmolLM2-1.7B**: Stable at ~0.3%.
- **Qwen2.5-3B**: Stable at ~0.3%.
#### tinyTruthfulQA - Baseline
- **Generation**: Starts at ~0.5%, peaks at iteration 2 (~0.6%), then declines to ~0.4%.
- **Multiple-choice**: Starts at ~0.2%, peaks at iteration 3 (~0.3%), then drops to ~0.2%.
- **Gemini 2.0-Flash**: Stable at ~0.6%.
- **Llama 3.1-8B**: Peaks at iteration 1 (~0.7%), then declines to ~0.5%.
- **DeepSeek-R1-Distill-Llama-8B**: Stable at ~0.6%.
- **Qwen2.5-14B**: Peaks at iteration 3 (~0.3%), then drops to ~0.2%.
- **SmolLM2-1.7B**: Stable at ~0.3%.
- **Qwen2.5-3B**: Stable at ~0.3%.
#### tinyTruthfulQA - CoT
- **Generation**: Peaks at iteration 2 (~0.6%), then declines to ~0.4%.
- **Multiple-choice**: Peaks at iteration 3 (~0.3%), then drops to ~0.2%.
- **Gemini 2.0-Flash**: Stable at ~0.6%.
- **Llama 3.1-8B**: Peaks at iteration 1 (~0.7%), then declines to ~0.5%.
- **DeepSeek-R1-Distill-Llama-8B**: Stable at ~0.6%.
- **Qwen2.5-14B**: Peaks at iteration 3 (~0.3%), then drops to ~0.2%.
- **SmolLM2-1.7B**: Stable at ~0.3%.
- **Qwen2.5-3B**: Stable at ~0.3%.
#### tinyTruthfulQA - Self-Consistency
- **Generation**: Peaks at iteration 2 (~0.6%), then declines to ~0.4%.
- **Multiple-choice**: Peaks at iteration 3 (~0.3%), then drops to ~0.2%.
- **Gemini 2.0-Flash**: Stable at ~0.6%.
- **Llama 3.1-8B**: Peaks at iteration 1 (~0.7%), then declines to ~0.5%.
- **DeepSeek-R1-Distill-Llama-8B**: Stable at ~0.6%.
- **Qwen2.5-14B**: Peaks at iteration 3 (~0.3%), then drops to ~0.2%.
- **SmolLM2-1.7B**: Stable at ~0.3%.
- **Qwen2.5-3B**: Stable at ~0.3%.
---
### Key Observations
1. **CoT and Self-Consistency** generally outperform **Baseline** in both tasks, with higher accuracy and stability.
2. **Gemini 2.0-Flash** and **DeepSeek-R1-Distill-Llama-8B** consistently achieve the highest accuracy (~0.6% in tinyTruthfulQA).
3. **Llama 3.1-8B** shows strong initial performance but declines over iterations.
4. **Multiple-choice** and **Qwen2.5-14B** exhibit the lowest accuracy, with minimal improvement across iterations.
5. **tinyTruthfulQA** graphs show higher baseline accuracy (~0.5-0.7%) compared to DisambiguationQA (~0.2-0.5%).
---
### Interpretation
The data suggests that **prompting methods** significantly impact model performance. **CoT** and **Self-Consistency** improve accuracy over **Baseline**, likely by encouraging structured reasoning. **Gemini 2.0-Flash** and **DeepSeek-R1-Distill-Llama-8B** outperform other models, indicating superior architecture or training for these tasks. The decline in accuracy for some models (e.g., Llama 3.1-8B) over iterations may reflect overfitting or sensitivity to input variations. **tinyTruthfulQA** tasks are inherently more challenging, as evidenced by lower overall accuracy compared to DisambiguationQA. The stability of certain models (e.g., Gemini 2.0-Flash) highlights their robustness to iterative changes.
DECODING INTELLIGENCE...