TECHNICAL ASSET FINGERPRINT
a0a93be8e558ca9eaec8986a
Click to view fullscreen
Press ESC or click to close
FOUND IN PAPERS
EXPERT: healer-alpha-free VERSION 1
RUNTIME: free/openrouter/healer-alpha
INTEL_VERIFIED
## Line Charts: Model Accuracy Across Iterations on DisambiguationQA and tinyTruthfulQA
### Overview
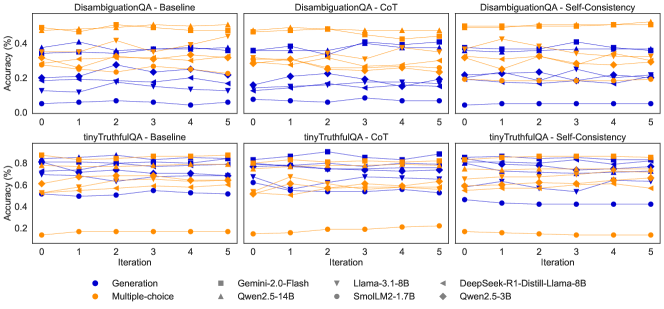
The image displays a 2x3 grid of six line charts comparing the performance of various large language models on two question-answering benchmarks ("DisambiguationQA" and "tinyTruthfulQA") across three prompting methods ("Baseline", "CoT" (Chain-of-Thought), and "Self-Consistency"). Performance is measured as accuracy percentage over 6 iterations (0 to 5). Each chart plots multiple lines, each representing a specific model, with line color indicating the task type (Generation or Multiple-choice) and marker shape indicating the specific model.
### Components/Axes
* **Chart Grid:** 2 rows x 3 columns.
* **Top Row Title:** `DisambiguationQA`
* **Bottom Row Title:** `tinyTruthfulQA`
* **Column Titles (Left to Right):** `Baseline`, `CoT`, `Self-Consistency`
* **Axes (Identical for all charts):**
* **X-axis:** Label: `Iteration`. Ticks: `0, 1, 2, 3, 4, 5`.
* **Y-axis:** Label: `Accuracy (%)`.
* Top Row (DisambiguationQA) Scale: `0.00` to `0.40` (increments of 0.10).
* Bottom Row (tinyTruthfulQA) Scale: `0.0` to `0.8` (increments of 0.2).
* **Legend (Located at the bottom center of the entire image):**
* **Task Type (Color):**
* Blue Circle: `Generation`
* Orange Circle: `Multiple-choice`
* **Model (Marker Shape & Label):**
* Gray Square: `Gemini-2.0-Flash`
* Gray Upward Triangle: `Qwen2.5-14B`
* Gray Downward Triangle: `Llama-3.1-8B`
* Gray Diamond: `SmolLM2-1.7B`
* Gray Left Triangle: `DeepSeek-R1-Distill-Llama-8B`
* Gray Right Triangle: `Qwen2.5-3B`
* **Note:** The legend uses gray for all model markers. In the charts, the lines are colored blue or orange based on the task type, and the specific model is identified by its unique marker shape on that colored line.
### Detailed Analysis
**1. DisambiguationQA - Baseline (Top-Left Chart)**
* **Trend:** Performance is generally low and stable across iterations for most models. There is a clear separation between task types.
* **Multiple-choice (Orange Lines):** Clustered in the upper band (~0.25 to ~0.38). The highest performer appears to be `Gemini-2.0-Flash` (square marker), starting near 0.38 and ending near 0.35. `Qwen2.5-14B` (up triangle) is also high, around 0.35.
* **Generation (Blue Lines):** Clustered in the lower band (~0.05 to ~0.20). The highest blue line is likely `Qwen2.5-14B` (up triangle), hovering around 0.18-0.20. The lowest is `SmolLM2-1.7B` (diamond), near 0.05.
**2. DisambiguationQA - CoT (Top-Middle Chart)**
* **Trend:** More variability and some upward trends compared to Baseline. The gap between task types narrows slightly.
* **Multiple-choice (Orange Lines):** Still generally higher, but with more fluctuation. `Gemini-2.0-Flash` (square) shows a dip at iteration 2 before recovering. Several models converge around 0.30-0.35 by iteration 5.
* **Generation (Blue Lines):** Shows more improvement. The top blue line (likely `Qwen2.5-14B`, up triangle) rises from ~0.20 to ~0.28. Other models like `Llama-3.1-8B` (down triangle) also show upward movement.
**3. DisambiguationQA - Self-Consistency (Top-Right Chart)**
* **Trend:** The highest overall performance and most distinct separation between top and bottom performers.
* **Multiple-choice (Orange Lines):** `Gemini-2.0-Flash` (square) is the clear leader, starting above 0.40 and maintaining a high level. `Qwen2.5-14B` (up triangle) is also strong, around 0.35-0.38.
* **Generation (Blue Lines):** The top blue line (`Qwen2.5-14B`, up triangle) performs well, around 0.30-0.32. A significant outlier is the lowest blue line (`SmolLM2-1.7B`, diamond), which remains very low, near 0.05-0.08.
**4. tinyTruthfulQA - Baseline (Bottom-Left Chart)**
* **Trend:** Extremely wide spread in performance. Some models excel, while others fail almost completely.
* **Multiple-choice (Orange Lines):** Two distinct clusters. Top cluster (`Gemini-2.0-Flash`, `Qwen2.5-14B`) is very high, ~0.75-0.80. Bottom cluster (`SmolLM2-1.7B`, `Qwen2.5-3B`) is very low, ~0.15-0.20.
* **Generation (Blue Lines):** Similar wide spread. Top blue line (`Qwen2.5-14B`, up triangle) is high, ~0.70. Bottom blue line (`SmolLM2-1.7B`, diamond) is near 0.10.
**5. tinyTruthfulQA - CoT (Bottom-Middle Chart)**
* **Trend:** Performance for top models remains high but shows more volatility. The low-performing cluster remains consistently poor.
* **Multiple-choice (Orange Lines):** Top models (`Gemini-2.0-Flash`, `Qwen2.5-14B`) fluctuate between 0.70 and 0.80. The low cluster (`SmolLM2-1.7B`, `Qwen2.5-3B`) stays flat near 0.20.
* **Generation (Blue Lines):** The top blue line (`Qwen2.5-14B`, up triangle) shows a notable dip at iteration 2 before recovering to ~0.70. The lowest blue line remains near 0.10.
**6. tinyTruthfulQA - Self-Consistency (Bottom-Right Chart)**
* **Trend:** Similar pattern to CoT, with high performers maintaining a lead and low performers stagnant.
* **Multiple-choice (Orange Lines):** `Gemini-2.0-Flash` (square) and `Qwen2.5-14B` (up triangle) are again top, ~0.75-0.80. The low cluster is unchanged.
* **Generation (Blue Lines):** The top blue line (`Qwen2.5-14B`, up triangle) is stable around 0.70. The lowest blue line (`SmolLM2-1.7B`, diamond) shows a slight upward tick at iteration 5 but remains below 0.20.
### Key Observations
1. **Task Type Dominance:** Across all charts and methods, **Multiple-choice** tasks (orange lines) consistently yield higher accuracy than **Generation** tasks (blue lines) for the same model.
2. **Model Performance Hierarchy:** A clear hierarchy exists. `Gemini-2.0-Flash` and `Qwen2.5-14B` are consistently top performers. `SmolLM2-1.7B` and `Qwen2.5-3B` are consistently the lowest performers, especially on tinyTruthfulQA.
3. **Benchmark Difficulty:** Models achieve significantly higher accuracy on **tinyTruthfulQA** (up to ~80%) compared to **DisambiguationQA** (max ~40%), suggesting the latter is a more challenging benchmark for these models.
4. **Prompting Method Impact:** Moving from **Baseline** to **CoT** and **Self-Consistency** generally improves performance, particularly for Generation tasks on DisambiguationQA. The effect is less pronounced on tinyTruthfulQA for the top models, as they are already near a performance ceiling.
5. **Stability:** Performance is relatively stable across iterations for most models, with some notable fluctuations (e.g., `Qwen2.5-14B` on tinyTruthfulQA-CoT at iteration 2).
### Interpretation
This data demonstrates the significant impact of both **task formulation** (Multiple-choice vs. Generation) and **prompting strategy** (Baseline, CoT, Self-Consistency) on LLM performance. The consistent superiority of Multiple-choice formats suggests that constrained output spaces are easier for models to handle accurately than open-ended generation for these QA tasks.
The stark performance gap between models like `Gemini-2.0-Flash` and `SmolLM2-1.7B` highlights the importance of model scale and capability. The fact that advanced prompting (CoT, Self-Consistency) provides a larger relative boost to weaker models on the harder benchmark (DisambiguationQA) indicates these techniques are most valuable for bridging capability gaps in complex reasoning tasks. Conversely, on the easier benchmark (tinyTruthfulQA), top models are already proficient, so advanced prompting yields diminishing returns.
The charts collectively argue that for reliable QA performance, one should consider: 1) using a capable base model, 2) framing the task as multiple-choice if possible, and 3) employing advanced prompting techniques like Self-Consistency, especially for challenging, ambiguous problems.
DECODING INTELLIGENCE...