\n
## Diagram: Multi-Layer Perceptron (Neural Network)
### Overview
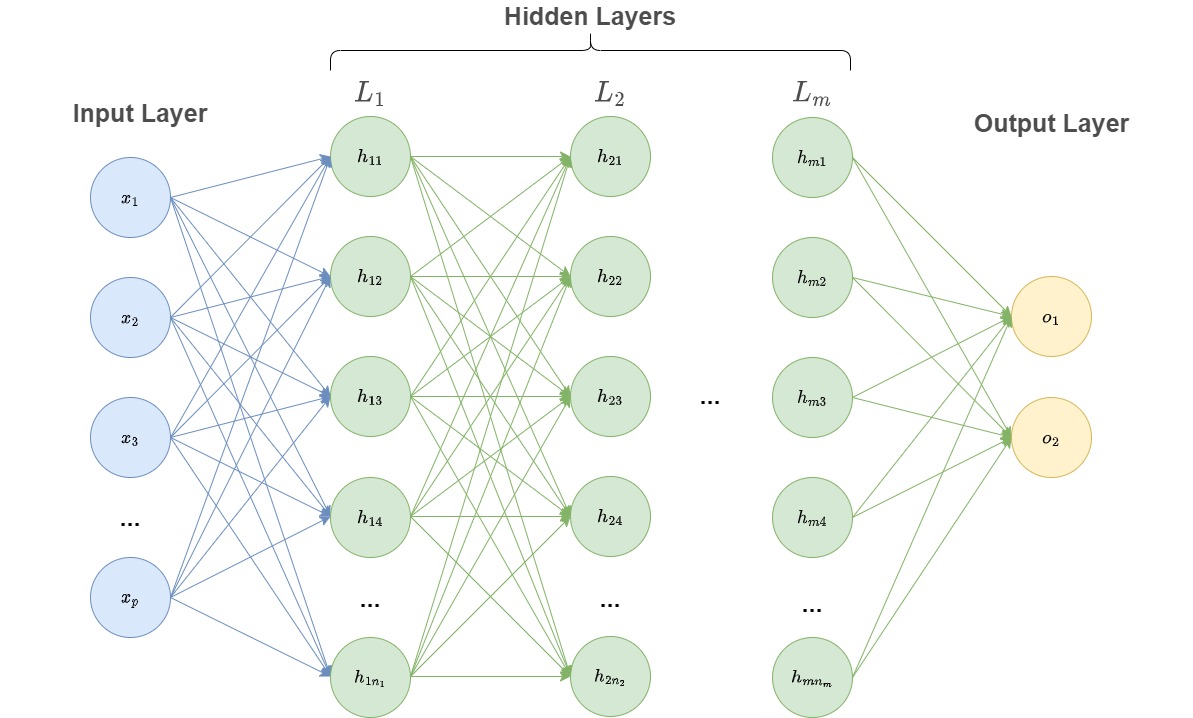
The image depicts a diagram of a multi-layer perceptron, a type of artificial neural network. It illustrates the connections between input, hidden, and output layers, showcasing a feedforward network structure. The diagram is primarily conceptual, demonstrating the architecture rather than specific numerical data.
### Components/Axes
The diagram consists of the following labeled components:
* **Input Layer:** Labeled "Input Layer" at the top-left. Contains nodes labeled x₁, x₂, x₃, ..., xₚ.
* **Hidden Layers:** Labeled "Hidden Layers" across the top-center. Specifically, layers L₁, L₂, ..., Lₘ are shown.
* **Layer L₁:** Contains nodes labeled h₁₁, h₁₂, h₁₃, h₁₄, ..., h₁ₙ₁.
* **Layer L₂:** Contains nodes labeled h₂₁, h₂₂, h₂₃, h₂₄, ..., h₂ₙ₂.
* **Layer Lₘ:** Contains nodes labeled hₘ₁, hₘ₂, hₘ₃, hₘ₄, ..., hₘₙₘ.
* **Output Layer:** Labeled "Output Layer" at the top-right. Contains nodes labeled o₁, o₂.
* **Connections:** Gray lines represent connections between nodes in adjacent layers. These connections are weighted, but the weights are not explicitly shown.
### Detailed Analysis or Content Details
The diagram shows a fully connected feedforward neural network.
* **Input Layer:** The input layer has 'p' number of nodes, represented by x₁, x₂, x₃, and so on up to xₚ.
* **Hidden Layers:** There are 'm' hidden layers. The first hidden layer (L₁) has 'n₁' nodes, the second (L₂) has 'n₂' nodes, and the last (Lₘ) has 'nₘ' nodes.
* **Connections:** Each node in a given layer is connected to every node in the subsequent layer. This is indicated by the dense network of gray lines.
* **Output Layer:** The output layer has two nodes, o₁ and o₂.
### Key Observations
* The diagram illustrates a fully connected network, meaning every neuron in one layer is connected to every neuron in the next layer.
* The number of layers and nodes per layer are variable, indicated by the use of subscripts (e.g., L₁, n₁, m).
* The diagram does not provide any information about activation functions, learning rates, or other training parameters.
* The diagram is a general representation and does not specify the specific application or task for which the network is designed.
### Interpretation
The diagram represents a fundamental architecture in deep learning – the multi-layer perceptron. It demonstrates how input data is processed through multiple layers of interconnected nodes to produce an output. The connections between nodes represent weighted sums, and the hidden layers allow the network to learn complex, non-linear relationships in the data. The diagram highlights the core concept of feature extraction and transformation that occurs within a neural network. The absence of specific values suggests this is a conceptual illustration rather than a depiction of a trained network with defined weights and biases. The diagram is a blueprint for a computational model, not a record of its performance.