## Neural Network Architecture Diagram
### Overview
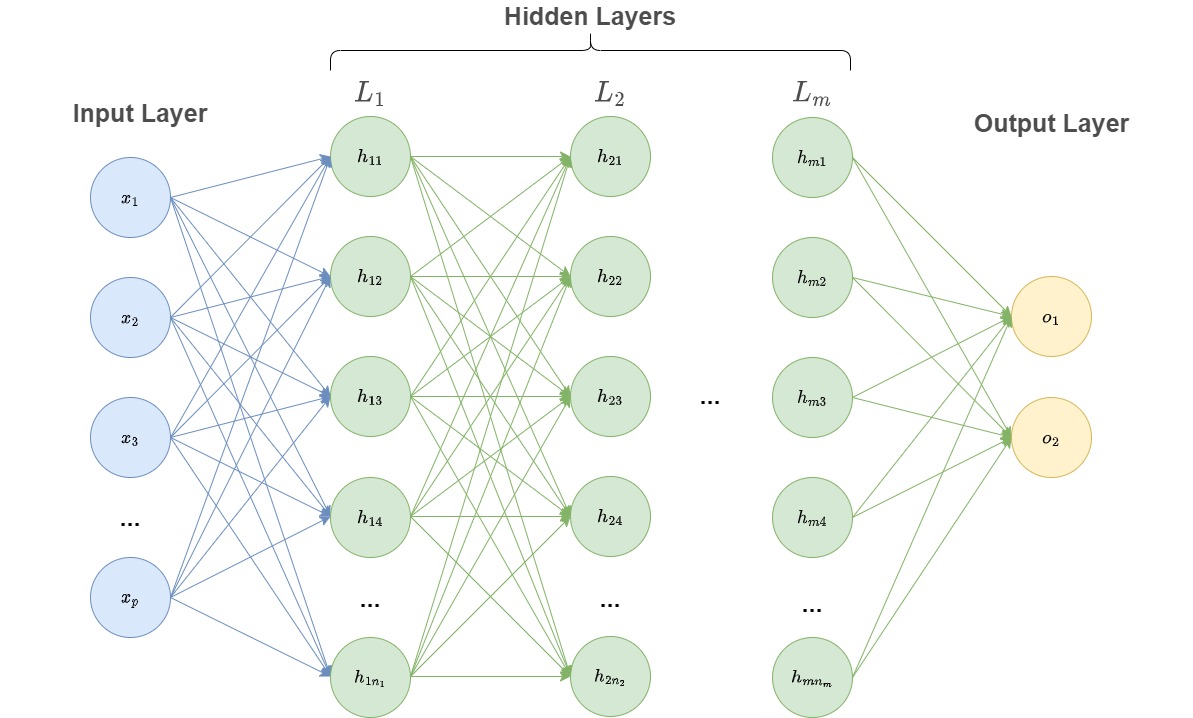
The image depicts a multi-layered artificial neural network with distinct input, hidden, and output layers. The architecture shows progressive transformations of input data through interconnected layers, culminating in output predictions.
### Components/Axes
1. **Input Layer** (Leftmost):
- Labeled "Input Layer"
- Contains nodes labeled x₁, x₂, ..., xₚ (p input features)
- Blue circular nodes with blue connecting lines
2. **Hidden Layers** (Center):
- Labeled "Hidden Layers" with sub-layers L₁ to Lₘ
- Each layer contains nodes with hierarchical numbering:
- L₁: h₁₁, h₁₂, ..., h₁ₙ₁
- L₂: h₂₁, h₂₂, ..., h₂ₙ₂
- ...
- Lₘ: hₘ₁, hₘ₂, ..., hₘₙₘ
- Green circular nodes with green connecting lines
- Dense interconnections between nodes within and across layers
3. **Output Layer** (Rightmost):
- Labeled "Output Layer"
- Contains nodes labeled o₁, o₂ (2 output units)
- Yellow circular nodes with green connecting lines from hidden layers
4. **Connections**:
- Input → Hidden: Blue lines
- Hidden → Hidden: Green lines
- Hidden → Output: Green lines
- No explicit activation functions or weights shown
### Detailed Analysis
- **Layer Structure**:
- Input layer (p nodes) → L₁ (n₁ nodes) → L₂ (n₂ nodes) → ... → Lₘ (nₘ nodes) → Output layer (2 nodes)
- Node counts increase/decrease across layers (n₁ > n₂ > ... > nₘ suggested by diagram density)
- **Color Coding**:
- Input: Blue (nodes and connections)
- Hidden: Green (nodes and connections)
- Output: Yellow (nodes), Green connections
- **Topology**:
- Fully connected architecture (every node in one layer connects to every node in the next)
- No skip connections or recurrent pathways visible
### Key Observations
1. The network has at least 3 layers (input, hidden, output) with potential for multiple hidden layers (L₁ to Lₘ)
2. Output layer has exactly 2 nodes, suggesting binary classification or regression task
3. Hidden layer node counts decrease progressively (n₁ > n₂ > ... > nₘ)
4. No explicit bias terms or activation functions depicted
5. All connections use consistent line styles within each connection type
### Interpretation
This diagram represents a standard feedforward neural network architecture with:
- **Input Processing**: Raw features (x₁...xₚ) transformed through multiple hidden layers
- **Feature Hierarchy**: Each hidden layer (L₁...Lₘ) likely learns increasingly abstract representations
- **Output Generation**: Final layer (Lₘ) produces predictions (o₁, o₂) through weighted combinations
The architecture suggests a deep learning approach where:
1. Early layers (L₁) capture basic feature combinations
2. Middle layers (L₂...Lₘ₋₁) learn complex patterns
3. Final hidden layer (Lₘ) makes high-level abstractions for output
The decreasing node count in hidden layers might indicate:
- Regularization through reduced capacity in deeper layers
- Computational efficiency considerations
- Domain-specific feature hierarchy requirements
The binary output (o₁, o₂) implies the network is designed for:
- Binary classification (e.g., spam/not-spam)
- Binary regression (e.g., yes/no prediction)
- Multi-label classification with two primary outputs