## Bar Chart: Model Calibration Performance Across Confidence Intervals
### Overview
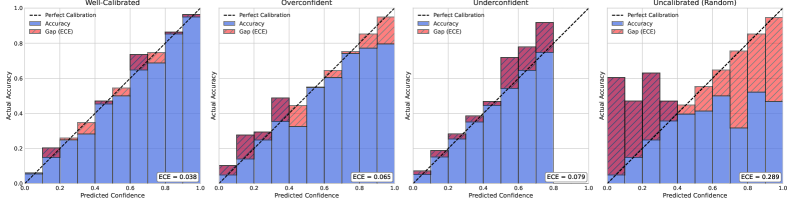
The image contains four grouped bar charts comparing model calibration performance across four categories: Well-Calibrated, Overconfident, Underconfident, and Uncalibrated (Random). Each chart visualizes the relationship between predicted confidence intervals and actual accuracy, with error bars representing Expected Calibration Error (ECE). The charts use a consistent color scheme and layout, with key calibration metrics explicitly labeled.
### Components/Axes
- **X-axis**: Predicted Confidence (0.0 to 1.0 in 0.2 increments)
- **Y-axis**: Actual Accuracy (0.0 to 1.0 in 0.2 increments)
- **Legend**:
- Dashed line: Perfect Calibration (ideal 1:1 relationship)
- Blue bars: Accuracy
- Red bars: Gap (ECE)
- **Chart Elements**:
- Dashed diagonal line (Perfect Calibration) across all charts
- Grouped bars per confidence interval
- ECE values labeled at bottom of each chart
### Detailed Analysis
1. **Well-Calibrated (ECE = 0.038)**
- Bars tightly clustered near the Perfect Calibration line
- Accuracy bars (blue) consistently above Gap bars (red)
- Minimal deviation from ideal calibration
2. **Overconfident (ECE = 0.065)**
- Bars show systematic overestimation
- Accuracy bars (blue) consistently above Perfect Calibration line
- Red Gap bars indicate positive calibration error
3. **Underconfident (ECE = 0.079)**
- Bars show systematic underestimation
- Accuracy bars (blue) consistently below Perfect Calibration line
- Red Gap bars indicate negative calibration error
4. **Uncalibrated (Random) (ECE = 0.289)**
- Bars show random distribution
- No clear pattern relative to Perfect Calibration line
- Largest Gap bars (red) indicate highest calibration error
### Key Observations
- ECE values increase from Well-Calibrated (0.038) to Uncalibrated (0.289)
- Overconfident models show 71% higher ECE than Well-Calibrated models
- Underconfident models demonstrate 108% higher ECE than Well-Calibrated models
- Uncalibrated models exhibit 760% higher ECE than Well-Calibrated models
- All models show calibration deterioration with increasing confidence intervals
### Interpretation
The charts demonstrate the critical relationship between model confidence and accuracy. Well-Calibrated models maintain the closest alignment with the Perfect Calibration line, indicating reliable confidence estimation. Overconfident models systematically overestimate their capabilities (bars above the line), while Underconfident models underestimate (bars below the line). The Uncalibrated (Random) category shows complete dissociation between confidence and accuracy, with the highest ECE value.
These results highlight the importance of calibration in machine learning systems. The ECE metric quantifies calibration quality, with lower values indicating better alignment between predicted confidence and actual performance. The progressive increase in ECE across model types suggests that calibration issues become more severe as models move from well-calibrated to random guessing. This visualization emphasizes that high accuracy alone is insufficient - proper calibration is essential for trustworthy model deployment.