## Line Graphs: Runtime Analysis Across Scaling Factors
### Overview
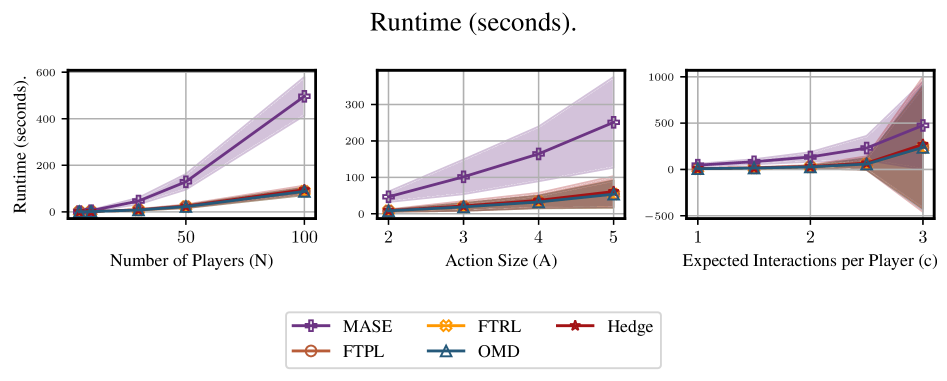
The image contains three line graphs comparing runtime performance (in seconds) of five algorithms (MASE, FTRL, Hedge, FTPL, OMD) across different scaling parameters: number of players, action size, and expected interactions per player. Each graph includes shaded confidence intervals and distinct markers/colors for algorithm identification.
### Components/Axes
1. **Left Chart**
- **X-axis**: Number of Players (N) [10, 50, 100]
- **Y-axis**: Runtime (seconds) [0–600]
- **Legend**:
- MASE (purple, `+` marker)
- FTRL (orange, `⊙` marker)
- Hedge (red, `★` marker)
- FTPL (brown, `□` marker)
- OMD (blue, `△` marker)
2. **Middle Chart**
- **X-axis**: Action Size (A) [2, 3, 4, 5]
- **Y-axis**: Runtime (seconds) [0–300]
- **Legend**: Same as left chart
3. **Right Chart**
- **X-axis**: Expected Interactions per Player (c) [1, 2, 3]
- **Y-axis**: Runtime (seconds) [-500–1000]
- **Legend**: Same as left chart
### Detailed Analysis
#### Left Chart (Number of Players)
- **MASE**: Steep upward trend.
- At N=10: ~10s
- At N=50: ~150s
- At N=100: ~500s
- **FTRL/Hedge**: Moderate growth.
- FTRL: ~5s (N=10) → ~30s (N=100)
- Hedge: ~7s (N=10) → ~40s (N=100)
- **FTPL/OMD**: Flattest performance.
- FTPL: ~2s (N=10) → ~15s (N=100)
- OMD: ~3s (N=10) → ~20s (N=100)
#### Middle Chart (Action Size)
- **MASE**: Linear increase.
- A=2: ~50s
- A=5: ~300s
- **FTRL/Hedge**: Sublinear growth.
- FTRL: ~10s (A=2) → ~50s (A=5)
- Hedge: ~12s (A=2) → ~55s (A=5)
- **FTPL/OMD**: Minimal increase.
- FTPL: ~8s (A=2) → ~40s (A=5)
- OMD: ~10s (A=2) → ~45s (A=5)
#### Right Chart (Interactions per Player)
- **MASE**: Exponential growth.
- c=1: ~50s
- c=3: ~300s
- **FTRL/Hedge**: Quadratic-like scaling.
- FTRL: ~10s (c=1) → ~80s (c=3)
- Hedge: ~12s (c=1) → ~90s (c=3)
- **FTPL/OMD**: Near-linear.
- FTPL: ~8s (c=1) → ~70s (c=3)
- OMD: ~10s (c=1) → ~85s (c=3)
### Key Observations
1. **MASE Dominates Scaling**: Runtime increases dramatically with all parameters, suggesting poor scalability.
2. **Hedge vs. FTRL**: Hedge consistently outperforms FTRL in runtime across all metrics.
3. **FTPL/OMD Efficiency**: These algorithms show the most stable performance, with minimal runtime increases.
4. **Confidence Intervals**: Shaded areas indicate higher variability for MASE, especially at large scales.
### Interpretation
The data demonstrates that MASE’s runtime grows disproportionately with system complexity (players, actions, interactions), making it unsuitable for large-scale applications. In contrast, Hedge and FTRL exhibit better scalability, though Hedge remains marginally faster. FTPL and OMD show the most efficient performance, maintaining near-constant runtime across scaling factors. The shaded regions highlight MASE’s higher uncertainty, likely due to its sensitivity to input parameters. This analysis suggests prioritizing Hedge or FTPL for systems requiring predictable performance under scaling constraints.