## Stacked Bar Chart: Latency Distribution by Model Configuration
### Overview
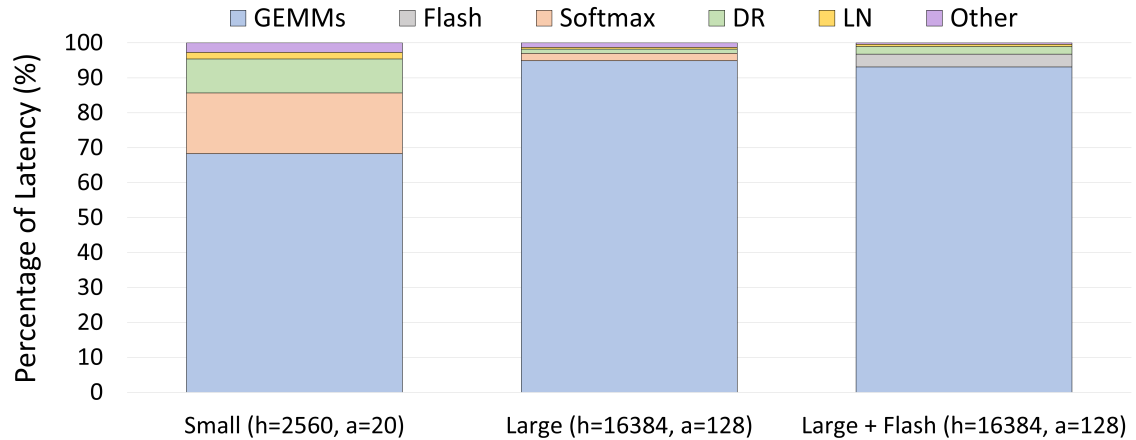
This image is a stacked bar chart comparing the percentage of latency attributed to different computational operations across three distinct model configurations. The chart illustrates how the distribution of latency shifts as model parameters (hidden size `h` and attention heads `a`) scale up and as specific optimizations (Flash) are applied.
### Components/Axes
* **Y-Axis:** "Percentage of Latency (%)", scaled from 0 to 100 in increments of 10.
* **X-Axis:** Three categorical configurations:
1. **Small (h=2560, a=20)**
2. **Large (h=16384, a=128)**
3. **Large + Flash (h=16384, a=128)**
* **Legend (Positioned at the top):**
* **GEMMs** (Blue)
* **Flash** (Grey)
* **Softmax** (Peach/Light Orange)
* **DR** (Light Green)
* **LN** (Yellow)
* **Other** (Purple)
### Detailed Analysis
The chart displays three vertical bars, each representing 100% of the latency for that specific configuration.
**1. Small (h=2560, a=20)**
* **Trend:** This bar shows the most diverse distribution of latency.
* **GEMMs (Blue):** Occupies the base, extending from 0% to approximately 68%.
* **Softmax (Peach):** Sits above GEMMs, extending from ~68% to ~85% (approx. 17% of total).
* **DR (Green):** Sits above Softmax, extending from ~85% to ~95% (approx. 10% of total).
* **LN (Yellow):** Sits above DR, extending from ~95% to ~97% (approx. 2% of total).
* **Other (Purple):** The top segment, extending from ~97% to 100% (approx. 3% of total).
**2. Large (h=16384, a=128)**
* **Trend:** A massive shift toward GEMMs dominance.
* **GEMMs (Blue):** Occupies the base, extending from 0% to approximately 95%.
* **Softmax (Peach):** Significantly reduced, extending from ~95% to ~97% (approx. 2% of total).
* **DR (Green):** Reduced, extending from ~97% to ~98% (approx. 1% of total).
* **LN (Yellow):** Reduced, extending from ~98% to ~99% (approx. 1% of total).
* **Other (Purple):** The top segment, extending from ~99% to 100% (approx. 1% of total).
* *Note:* The "Flash" (Grey) category is absent in this configuration.
**3. Large + Flash (h=16384, a=128)**
* **Trend:** Similar to the "Large" configuration, but with the introduction of the "Flash" component.
* **GEMMs (Blue):** Occupies the base, extending from 0% to approximately 93%.
* **Flash (Grey):** Appears here, extending from ~93% to ~97% (approx. 4% of total).
* **DR (Green):** Extends from ~97% to ~98% (approx. 1% of total).
* **LN (Yellow):** Extends from ~98% to ~99% (approx. 1% of total).
* **Other (Purple):** The top segment, extending from ~99% to 100% (approx. 1% of total).
* *Note:* The "Softmax" (Peach) category is effectively absent or negligible in this configuration.
### Key Observations
* **GEMM Dominance:** GEMMs (General Matrix Multiplies) are the primary latency bottleneck in all configurations, accounting for at least 68% of latency in the smallest model and rising to ~95% in the larger models.
* **Scaling Effect:** As the model scales from "Small" to "Large," the relative latency of non-GEMM operations (specifically Softmax and DR) drops precipitously.
* **Flash Integration:** The introduction of "Flash" (likely referring to FlashAttention) in the third configuration consumes ~4% of the latency budget. Notably, its introduction correlates with the disappearance of the "Softmax" segment, suggesting that FlashAttention replaces or optimizes the standard Softmax operation.
### Interpretation
The data demonstrates that as Transformer-based models scale up in size (increasing hidden dimension and attention heads), the computational workload becomes increasingly dominated by matrix multiplications (GEMMs). In smaller models, overhead operations like Softmax and DR are significant contributors to latency. However, in larger models, these operations become negligible relative to the GEMM workload. The "Large + Flash" configuration indicates that while the Flash optimization introduces its own latency cost (~4%), it likely provides a more efficient implementation of the attention mechanism, effectively absorbing or replacing the traditional Softmax operation, which is no longer visible in the third bar. This suggests that for large models, optimizing GEMMs is the most critical path for performance, while FlashAttention is a necessary optimization for the attention mechanism.