\n
## Diagram: Conceptual Model of Sentiment and Engagement
### Overview
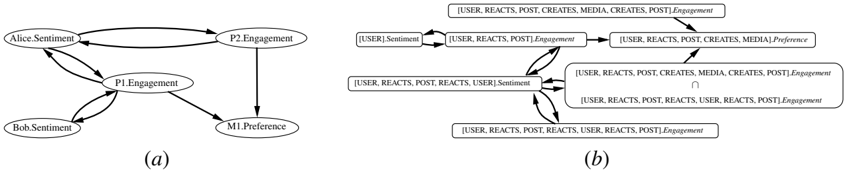
The image presents two diagrams, labeled (a) and (b), depicting conceptual models of sentiment and engagement. Both diagrams use nodes (ovals/rectangles) to represent concepts and directed edges (arrows) to represent relationships between them. Diagram (a) appears to model a dyadic interaction between Alice and Bob, while diagram (b) focuses on user interactions with content.
### Components/Axes
Diagram (a) includes the following nodes:
* Alice.Sentiment
* P2.Engagement
* Bob.Sentiment
* M1.Preference
* P1.Engagement
Diagram (b) includes the following nodes:
* [USER.Sentiment]
* [USER, REACTS, POST, POST].Engagement
* [USER, REACTS, POST, CREATES].MediaPreference
* [USER, REACTS, POST, CREATES, MEDIA, POST].Engagement
* [USER, REACTS, POST, REACTS, USER].Sentiment
* [USER, REACTS, POST, REACTS, USER, REACTS, POST].Engagement
The diagrams do not have explicit axes, scales, or legends in the traditional chart sense. The relationships are indicated by the direction of the arrows.
### Detailed Analysis or Content Details
**Diagram (a):**
* An arrow originates from "Alice.Sentiment" and points to "P2.Engagement".
* An arrow originates from "Bob.Sentiment" and points to "P1.Engagement".
* An arrow originates from "P2.Engagement" and points to "Bob.Sentiment".
* An arrow originates from "P1.Engagement" and points to "Alice.Sentiment".
* An arrow originates from "Bob.Sentiment" and points to "M1.Preference".
* An arrow originates from "P1.Engagement" and points to "M1.Preference".
**Diagram (b):**
* An arrow originates from "[USER.Sentiment]" and points to "[USER, REACTS, POST, POST].Engagement".
* An arrow originates from "[USER, REACTS, POST, POST].Engagement" and points to "[USER, REACTS, POST, CREATES].MediaPreference".
* An arrow originates from "[USER, REACTS, POST, POST].Engagement" and points to "[USER, REACTS, POST, CREATES, MEDIA, POST].Engagement".
* An arrow originates from "[USER, REACTS, POST, CREATES].MediaPreference" and points to "[USER, REACTS, POST, CREATES, MEDIA, POST].Engagement".
* An arrow originates from "[USER, REACTS, POST, CREATES, MEDIA, POST].Engagement" and points to "[USER, REACTS, POST, REACTS, USER].Sentiment".
* An arrow originates from "[USER, REACTS, POST, REACTS, USER].Sentiment" and points to "[USER, REACTS, POST, REACTS, USER, REACTS, POST].Engagement".
* An arrow originates from "[USER, REACTS, POST, REACTS, USER, REACTS, POST].Engagement" and points to "[USER, REACTS, POST, REACTS, USER].Sentiment".
### Key Observations
* Diagram (a) shows a reciprocal relationship between Alice and Bob's sentiments and their respective engagements. It suggests a feedback loop where sentiment influences engagement, and engagement influences sentiment.
* Diagram (b) depicts a more complex flow of user interactions, starting with sentiment, progressing through various engagement levels (reacting, posting, creating), and ultimately influencing further sentiment and engagement.
* The nodes in diagram (b) are described with increasingly detailed actions, suggesting a progression of user activity.
* The intersection symbol (∩) in diagram (b) indicates a logical AND operation between two engagement nodes.
### Interpretation
Diagram (a) likely represents a simplified model of social interaction, where individuals' sentiments influence their engagement with each other, and vice versa. The model suggests that sentiment and engagement are mutually reinforcing.
Diagram (b) appears to model the relationship between user sentiment and engagement with online content. The diagram suggests that user sentiment drives initial engagement (reacting, posting), which then leads to more complex engagement (creating media). This, in turn, influences further sentiment and engagement, creating a cycle. The increasing detail in the engagement nodes suggests that more active engagement leads to a more nuanced understanding of user sentiment. The intersection symbol indicates that a certain level of engagement is required to trigger a specific sentiment response.
The diagrams, taken together, could be interpreted as a model of how social interactions and online engagement influence sentiment and behavior. They highlight the importance of feedback loops and the complex interplay between individual emotions and external stimuli. The diagrams are conceptual and do not provide quantitative data, but they offer a framework for understanding the dynamics of sentiment and engagement.